
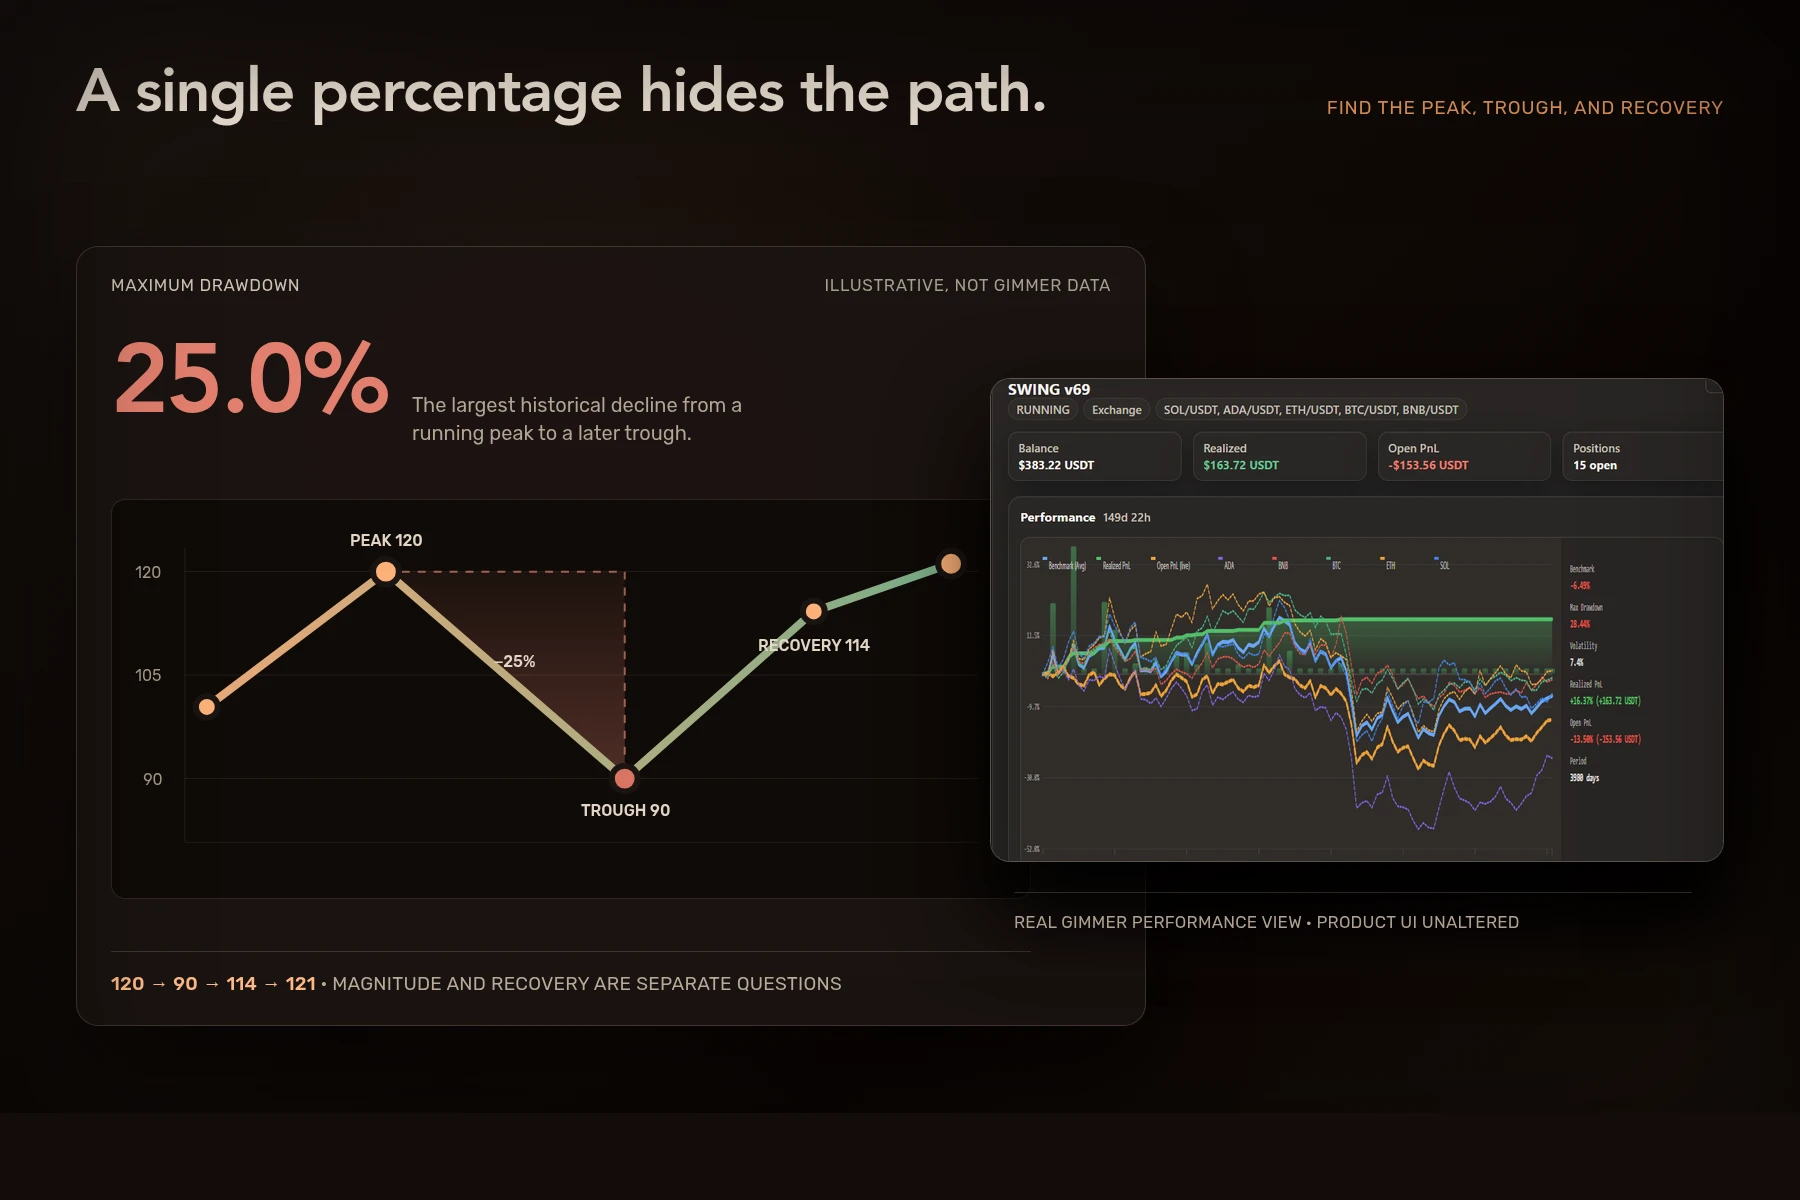
A crypto backtest maximum drawdown is the largest percentage decline from an equity peak to a later trough inside one historical run. It answers a specific question: how deep was the worst observed fall before the series established a new high? The number does not show how long the decline lasted, whether the run recovered, which costs were included, what remained open, or what will happen in a live market.
How crypto backtest maximum drawdown is calculated
At each point in an equity series, keep the highest value observed so far. Compare the current value with that running peak:
Drawdown = (running peak − current equity) ÷ running peak × 100
Maximum drawdown is the largest of those declines. The calculation needs an ordered path. Start and end balances alone are not enough.
Follow the peak, trough, and recovery
Consider this deliberately simple equity index:
| Step | Equity index | Running peak | Drawdown |
|---|---|---|---|
| Start | 100 | 100 | 0% |
| New peak | 120 | 120 | 0% |
| Trough | 90 | 120 | 25% |
| Partial recovery | 114 | 120 | 5% |
| New high | 121 | 121 | 0% |
The maximum drawdown is 25% because the path fell from 120 to 90. At 114, the drawdown is smaller, but the old peak has not been recovered. Only the move to 121 resets the running peak.
These figures illustrate the arithmetic only. They are not Gimmer results, cryptocurrency market data, a risk limit, or a recommendation.
The same ending value can hide a different loss path
Two tests can start at 100 and finish at 115 while exposing very different journeys:
- Path A: 100, 110, 105, 115. Its largest decline is about 4.5%, from 110 to 105.
- Path B: 100, 125, 80, 115. Its largest decline is 36%, from 125 to 80, and it finishes below its earlier peak.
The shared final value does not make the paths equivalent. Maximum drawdown reveals the deepest historical loss from a prior high, while the path shows when it happened and whether the test recovered.
Keep the measurement boundary beside maximum drawdown
The percentage can change when the underlying series changes. Before comparing two results, record:
- whether the series is sampled on every modeled event, candle close, day, or another interval;
- whether equity includes open positions or only realized results;
- which fees, spread, slippage, funding, borrowing, or network costs are represented;
- the quote currency, starting balance, markets, and test dates;
- whether the final drawdown recovered before the run ended.
CFA Institute’s overview of maximum drawdown and measurement frequency notes that a monthly series can show a smaller drawdown than a daily series because fewer points are observed. That does not make one interval wrong. It means the interval belongs in the metric contract.
Read maximum drawdown in Gimmer’s backtest context
In the current Gimmer Backtest Report, Max Drawdown appears in the Risk View with the description Peak-to-trough decline. A separate Drawdown over time view keeps the historical path visible. Use the run period, balances, open positions, Open PnL, and position journal around that risk view rather than lifting one percentage out of context.
Gimmer’s public Running Backtest guide explains how to choose a period, run the saved configuration, and review the result and history. It also keeps the central limitation visible: historical output describes the tested inputs and assumptions, not future performance.
Maximum drawdown and volatility are not substitutes
Maximum drawdown records the deepest observed peak-to-trough decline in an ordered path. Volatility summarizes dispersion in a defined return series. A path can have one severe drawdown surrounded by calmer periods, and two paths with similar volatility can reach different troughs.
Use the crypto backtest volatility checklist to align return interval and annualization. Then keep both measures beside the equity curve instead of asking either one to describe every form of risk.
Check costs, sample coverage, and the comparison period
A shallow historical drawdown can reflect a favorable window, sparse decisions, or optimistic execution assumptions. Confirm that the equity path includes the intended cost model with the backtest trading-cost guide. Then inspect the number and distribution of decisions with the crypto backtest sample-size checklist.
If a benchmark is part of the review, align its dates, capital basis, quote currency, costs, and exposure using the crypto backtest benchmark framework. A smaller drawdown is not a complete comparison when the two paths took different risks or were measured differently.
An eight-step maximum-drawdown checklist
- Identify the exact run. Record the strategy revision, markets, dates, interval, and starting balance.
- Define the equity series. State when it is sampled and how open positions are valued.
- Mark the running peaks. A drawdown begins only after a prior high in that series.
- Locate the deepest trough. Recalculate its percentage from the associated peak.
- Measure the time underwater. Record the decline, trough, and recovery dates separately from the magnitude.
- Check the unfinished edge. Note whether the test ends below its last peak or with open exposure.
- Align costs and sampling. Do not compare percentages produced from different measurement contracts.
- Challenge the result. Repeat the same review on an out-of-sample period after the strategy is locked.
Frequently asked questions
What is a good maximum drawdown for a crypto backtest?
There is no universal threshold. A tolerable drawdown depends on the strategy, capital constraints, leverage, liquidity, time horizon, and how the equity series was measured. Use the number to compare explicit historical paths, not to certify a strategy or cap a future loss.
Is drawdown the same as a losing trade?
No. A losing trade is one closed outcome. Drawdown describes how the equity series sits below a prior peak and can reflect several positions, costs, or open valuation changes depending on the report’s method.
Why do platforms report different maximum drawdowns?
They may sample equity at different intervals, value open positions differently, include different costs, use different historical data, or define the test boundary differently. Compare the method before comparing the percentage.
Keep the loss path reproducible
A crypto backtest maximum drawdown becomes useful when another reviewer can identify the same peak and trough, see the recovery state, and reproduce the result from the same equity series. Keep magnitude, duration, sampling, costs, open exposure, and test dates together.
For the next review, open Gimmer’s Running Backtest guide, choose one completed run, and record its peak, trough, recovery state, measurement interval, costs, and open exposure. Compare it with another run only after those boundaries match, and treat both results as evidence about tested history rather than a forecast.
Pingback: Crypto Backtest Monte Carlo Analysis: Resample the Trade Path – Gimmer – Automated Crypto-Trading