
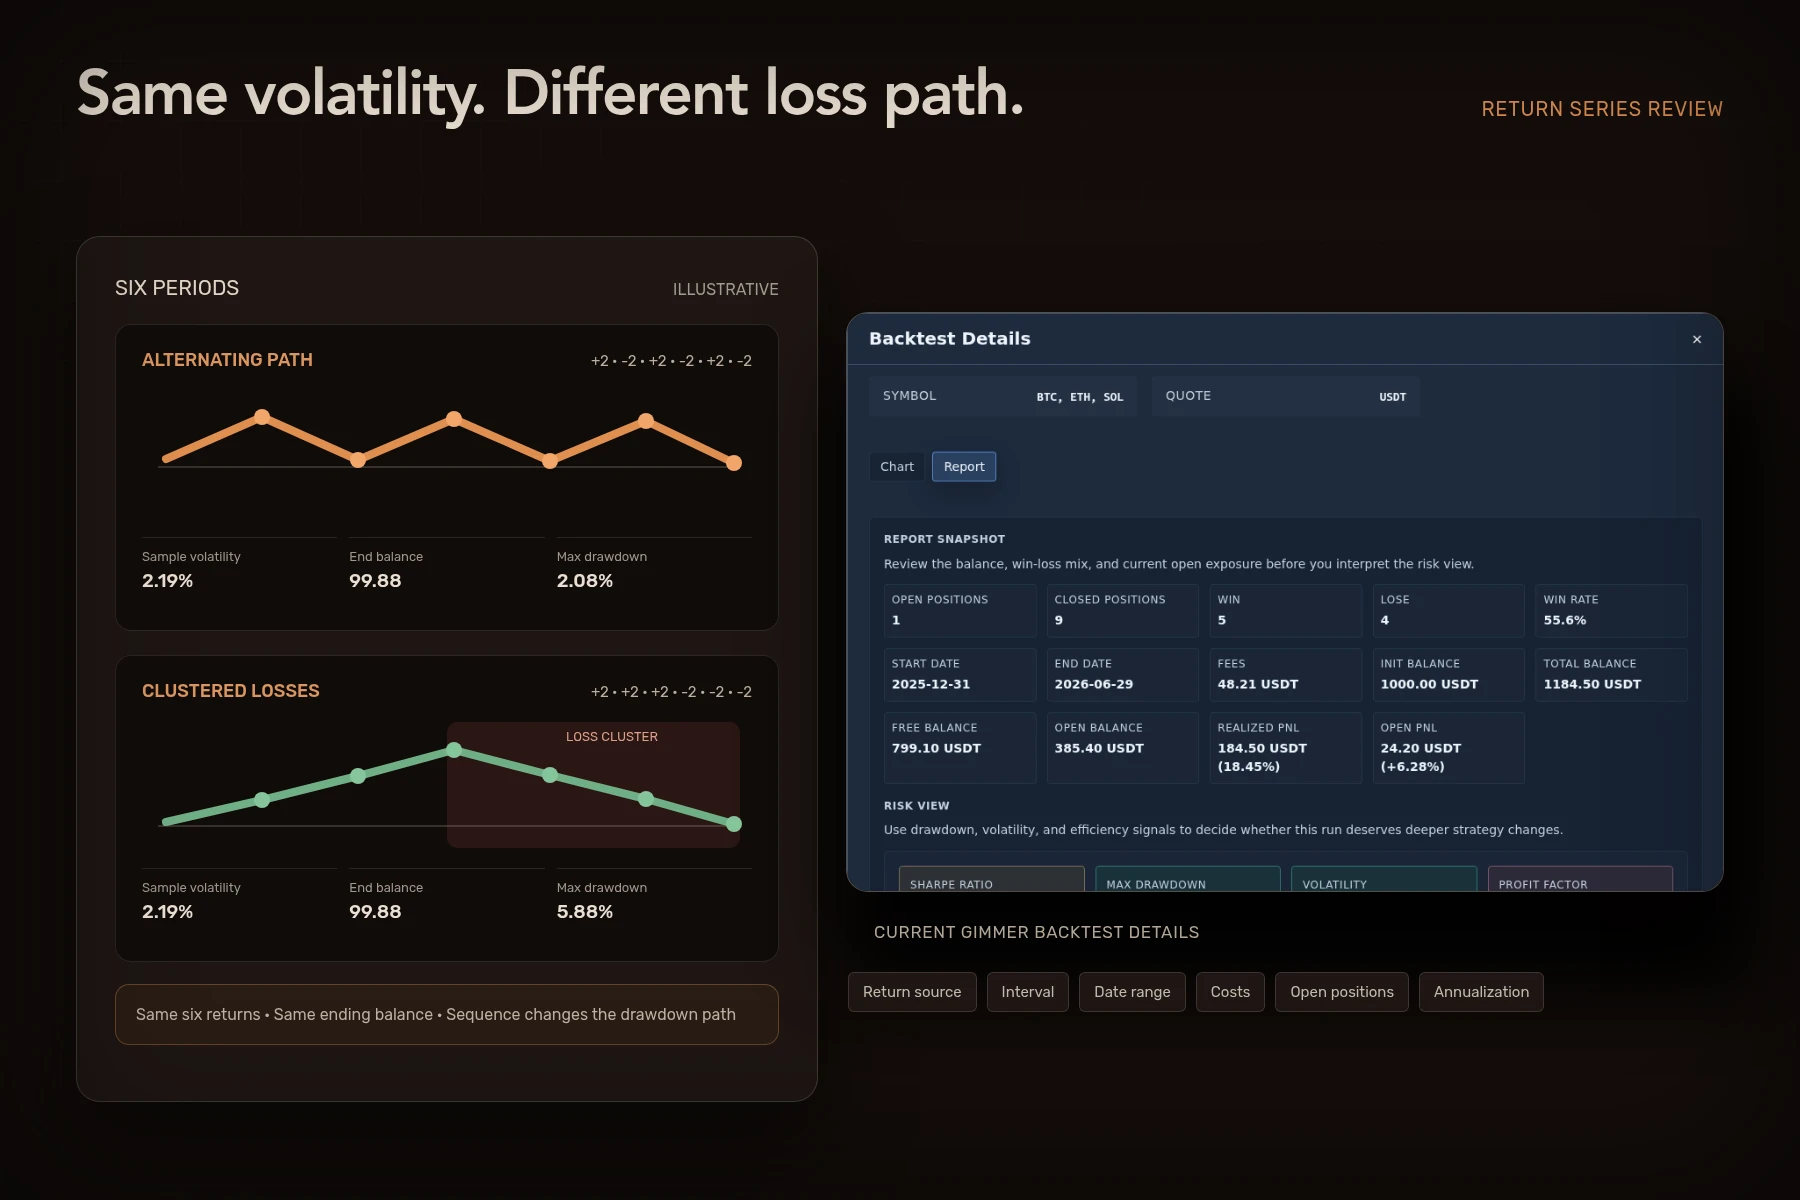
Crypto backtest volatility describes how widely a defined series of historical returns moved around its average. It does not show when losses occurred, how deep the worst decline became, or what will happen next. Before comparing two volatility figures, confirm the return source, sampling interval, date range, cost and open-position treatment, standard-deviation convention, and annualization method. Then read the number beside the equity path, maximum drawdown, positions, and fees.
What crypto backtest volatility measures
One common historical convention calculates the standard deviation of periodic returns. First find the average return for the selected intervals. Then measure how far each return sits from that average. Larger deviations produce a larger volatility figure.
The U.S. National Institute of Standards and Technology explains in its Measures of Scale guidance that standard deviation is the square root of variance. NIST also distinguishes spread near the center from behavior in the tails. That is a useful limit: one dispersion summary cannot describe every feature of a return path.
This article uses sample standard deviation in its small example. It does not claim that every platform, or Gimmer specifically, uses that exact return source or convention. Check the method attached to the result you are reading.
Price volatility is not automatically strategy volatility
Market-price volatility describes movement in an asset or market series. Backtest volatility may instead describe returns from strategy equity, account balance, trades, or another defined output. Those are different questions.
Record whether the calculation uses candle-to-candle market returns, closed-trade returns, daily account equity, realized balance, or equity including open PnL. A strategy can trade a volatile market infrequently, or produce a volatile equity path in a quieter period. The input series must be named before the value is interpretable.
Same volatility, different loss sequence
Consider two illustrative six-period paths starting from 100.00. Both use the same returns: three periods at +2% and three at -2%. Only the order changes.
| Input or result | Alternating path | Clustered-loss path |
|---|---|---|
| Return order | +2%, -2%, +2%, -2%, +2%, -2% | +2%, +2%, +2%, -2%, -2%, -2% |
| Arithmetic average | 0.00% | 0.00% |
| Sample standard deviation | About 2.19% | About 2.19% |
| Ending balance | About 99.88 | About 99.88 |
| Maximum peak-to-trough drawdown | About 2.08% | About 5.88% |
The volatility and ending balance match because both paths contain the same returns. The clustered-loss path still falls much farther from its peak. This is not Gimmer output, exchange data, or a recommendation. It is transparent arithmetic showing why volatility and drawdown answer different questions.
The sampling interval changes the question
Hourly, daily, weekly, and trade-by-trade returns can produce different averages, standard deviations, and observation counts. Combining incomplete candles with closed candles can also change the series.
Use the crypto trading bot timeframe checklist to connect the interval to the strategy’s decision cadence. Then use the crypto backtest data checklist to record the source, timestamps, missing intervals, and final-candle rule. Do not annualize a value until the observation interval and factor are explicit.
Audit seven inputs before comparing volatility
- Return source: Name the price, trade, balance, or equity series used.
- Sampling interval: Record whether observations are hourly, daily, per trade, or another cadence.
- Date range: Keep the start, end, time zone, and market regime visible.
- Costs: State which fees and execution assumptions are already reflected in the returns.
- Open positions: Confirm whether unrealized changes are included and how the final position is valued.
- Dispersion convention: Record whether the calculation uses sample or population standard deviation, or another scale measure.
- Annualization: If the result is annualized, record the factor and the observation count it assumes.
If one input is missing, label the comparison incomplete. Precision in the displayed decimal places cannot recover an unknown method.
Read volatility beside the full Gimmer report
Gimmer’s current Product Overview shows volatility beside benchmark, realized PnL, open PnL, and drawdown, and says that return alone cannot describe risk, exposure, or execution quality. That is the right reading posture for any historical result.
The guide to reading Gimmer’s Backtest Details places Volatility in Risk View with Sharpe Ratio, Max Drawdown, Profit Factor, and Drawdown over time. Keep Report Snapshot and the Position journal in the review too. A single risk figure should not approve a strategy or hide open exposure.
Connect volatility to Sharpe ratio without collapsing the review
Volatility can appear inside a risk-adjusted measure, but the combined score inherits the return interval, cost boundary, reference, and annualization choices behind it. The crypto backtest Sharpe ratio input checklist explains that comparison boundary.
Do not use a favorable ratio to skip the underlying volatility series. Also do not use low volatility to skip drawdown, trade count, position concentration, fees, or the sequence of losses. Each view preserves evidence that one summary discards.
Frequently asked questions
Is volatility the same as maximum drawdown?
No. Volatility summarizes dispersion in a defined return series. Maximum drawdown measures the largest peak-to-trough decline in the tested equity path. The example above has matching volatility but different drawdown because the loss order changes.
Does lower backtest volatility mean a better crypto strategy?
No. Lower dispersion does not establish profitability, future behavior, acceptable drawdown, sufficient trade count, liquidity, or execution quality. Read it as one historical characteristic under a documented method.
Can two platforms report different volatility for the same strategy?
Yes. They may use different return sources, intervals, date boundaries, cost treatment, open-position valuation, standard-deviation conventions, or annualization factors. Compare the calculation inputs before comparing the numbers.
Make the volatility figure reproducible
Crypto backtest volatility becomes useful when another reviewer can reconstruct the series and method behind it. It becomes misleading when the return source, interval, and path disappear behind one percentage.
For the next historical run, open Gimmer’s Running Backtest guide and record the seven inputs above. Then compare volatility with the equity path, maximum drawdown, positions, fees, and trade record. Treat the result as evidence about tested history, not a promise about future trading.
Pingback: Crypto Backtest Maximum Drawdown: Read the Path Behind the Percentage – Gimmer – Automated Crypto-Trading
Pingback: Crypto Backtest Return Distribution: Look Beyond the Average – Gimmer – Automated Crypto-Trading