
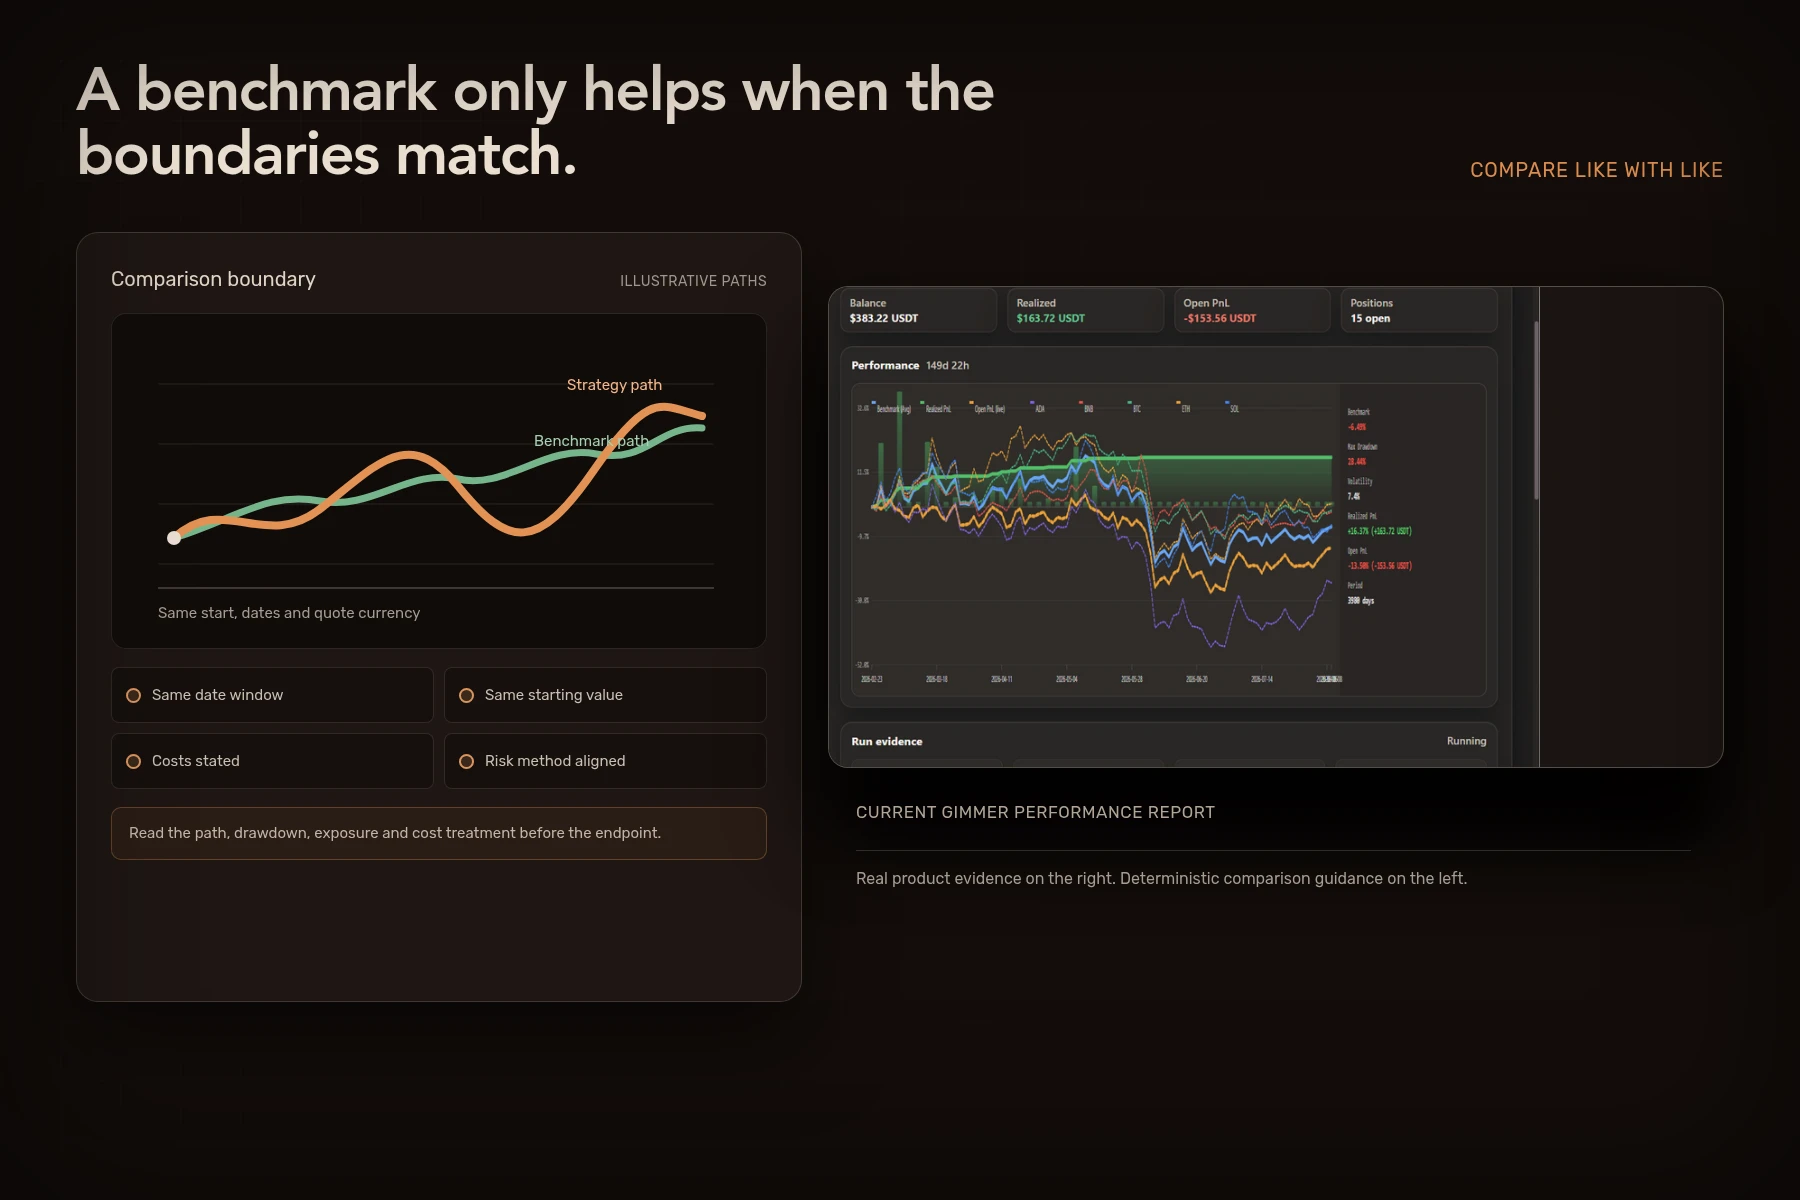
A crypto backtest benchmark is a comparison series, not a verdict. It helps you ask whether a strategy’s historical path differed from relevant passive market movement over the same dates. The comparison is only useful when both sides use compatible starting values, quote currency, cost treatment, exposure, and risk definitions. If those boundaries do not match, an apparent lead may describe the setup more than the strategy.
What a crypto backtest benchmark can show
A benchmark adds context to a result that would otherwise stand alone. If a crypto strategy rose during a period when the selected market also rose, the benchmark helps separate broad market movement from the strategy’s specific decisions.
Gimmer’s public Running Backtest guide describes benchmark context as a comparison with passive market movement. It also warns against ignoring risk and capital differences between the series. That distinction matters: a benchmark can make the next question clearer, but it cannot approve a strategy.
A benchmark does not show that:
- the strategy will behave the same way in a later market;
- the benchmark was investable with the displayed assumptions;
- both paths used equal fees, spread, slippage, leverage, or cash treatment;
- the strategy used capital as consistently as the comparison series; or
- a higher endpoint came with an acceptable loss path.
Match the comparison boundary first
Before reading which line finished higher, record the boundary for both series. Investor.gov’s Performance Claims bulletin notes that an appropriate benchmark should fit the market segment being compared and that benchmark performance may use a different fee treatment. Although that bulletin addresses investment performance presentations, the same comparison discipline is useful when reviewing historical strategy evidence.
| Boundary | Strategy series | Benchmark series |
|---|---|---|
| Dates and timezone | Exact first and last included candle | The same window and timestamp rule |
| Starting value | Initial balance and quote currency | Normalized to the same starting value and currency |
| Market scope | Pairs, assets, and selection rules | A relevant asset, basket, or passive path |
| Costs | Fees and execution assumptions | Any costs included, excluded, or unavailable |
| Capital use | Cash, position size, leverage, and open exposure | Allocation and rebalancing assumptions |
| Risk method | Equity, drawdown, and open PnL treatment | The comparable path and calculation boundary |
If one row cannot be completed, label the comparison incomplete. Do not silently replace the missing assumption with the visual distance between two lines.
A higher endpoint can hide a different path
Consider two illustrative series normalized to 10,000 units for the same 90-day period:
| Measure | Illustrative strategy | Illustrative benchmark |
|---|---|---|
| Starting value | 10,000 units | 10,000 units |
| Ending value | 10,800 units | 10,600 units |
| Maximum drawdown | 18% | 9% |
| Displayed cost treatment | 120 units modeled | No trading costs modeled |
The strategy finishes two percentage points ahead, but it also shows twice the maximum drawdown in this simplified example. The cost treatments differ, and the table says nothing yet about time in the market, open exposure, leverage, or concentration. The endpoint difference is a prompt to inspect the path, not proof that one series is better.
These figures are transparent teaching arithmetic. They are not Gimmer results, exchange data, market data, a forecast, or a recommendation.
Compare the path as well as the return
Two series can start and finish in similar places while exposing the operator to very different conditions between those points. Use the chart to locate questions, then use the report and position record to answer them.
Drawdown and recovery
Record the largest peak-to-trough decline and how long the series remained below its prior peak. Confirm that open positions are included consistently. The guide to reading Gimmer’s Backtest Details explains why the chart, report summary, open PnL, and positions should be read together.
Variability and concentration
Ask whether the apparent lead came from one short event, one pair, or one cluster of trades. The crypto backtest volatility checklist shows why interval, return definition, annualization, and missing observations belong beside any variability figure.
Costs and turnover
A passive comparison and an active strategy may generate very different numbers of transactions. Keep fees and other execution assumptions visible rather than subtracting costs from one side only. Use the crypto trading bot fee checklist to record what the historical model included.
Do not confuse benchmark, baseline, and target
These three references answer different questions:
- Benchmark: How did a relevant passive market path behave over the same comparison boundary?
- Baseline: How did the original strategy configuration behave before a controlled parameter change?
- Target: What internal threshold or operating limit did you define before reading the result?
Gimmer’s public Strategy Optimizer guide treats the original strategy run as the baseline and explicitly says it is not a recommendation. A candidate can beat that baseline while still lagging relevant market context, showing worse drawdown, or failing on unseen data. The labels are not interchangeable.
Use a six-question benchmark review
- Relevance: Does the benchmark represent the asset, basket, or market exposure the strategy actually faced?
- Alignment: Do both series use the same dates, timestamps, starting value, and quote currency?
- Costs: Which fees and execution assumptions are included on each side?
- Capital: How do cash, position size, leverage, and time in the market differ?
- Path: What happened to drawdown, variability, open exposure, and recovery before the endpoint?
- Validation: Did the interpretation survive a later range that was not used to tune the strategy?
The last question matters because a clean historical comparison can still be specific to one market regime. The out-of-sample backtesting guide provides a practical split for testing a locked strategy revision on unseen dates.
Frequently asked questions
What is a benchmark in a crypto backtest?
It is a comparison series used to add market context to a strategy’s historical path. Depending on the question, it may be one relevant asset, a passive basket, or another explicitly defined reference. It is not automatically the strategy’s baseline or a recommendation.
Is buy and hold always the right benchmark?
No. A single-asset passive path may fit a strategy that trades that asset, but it may be misleading for a multi-asset, market-neutral, leveraged, or frequently uninvested strategy. Name the exposure being compared and explain why the reference is relevant.
What if the benchmark assumptions are unavailable?
Keep the missing boundary visible and limit the conclusion. You can still inspect the strategy’s own equity, drawdown, positions, and costs, but you should not present an unmatched visual comparison as precise evidence.
Turn the benchmark into a better question
A crypto backtest benchmark is most useful when it stops an isolated return from becoming the whole story. Match the comparison boundary, inspect the path, and keep benchmark, baseline, and target separate.
For your next historical run, open Gimmer’s Running Backtest guide and record the six comparison boundaries in one row before deciding what the chart supports.