
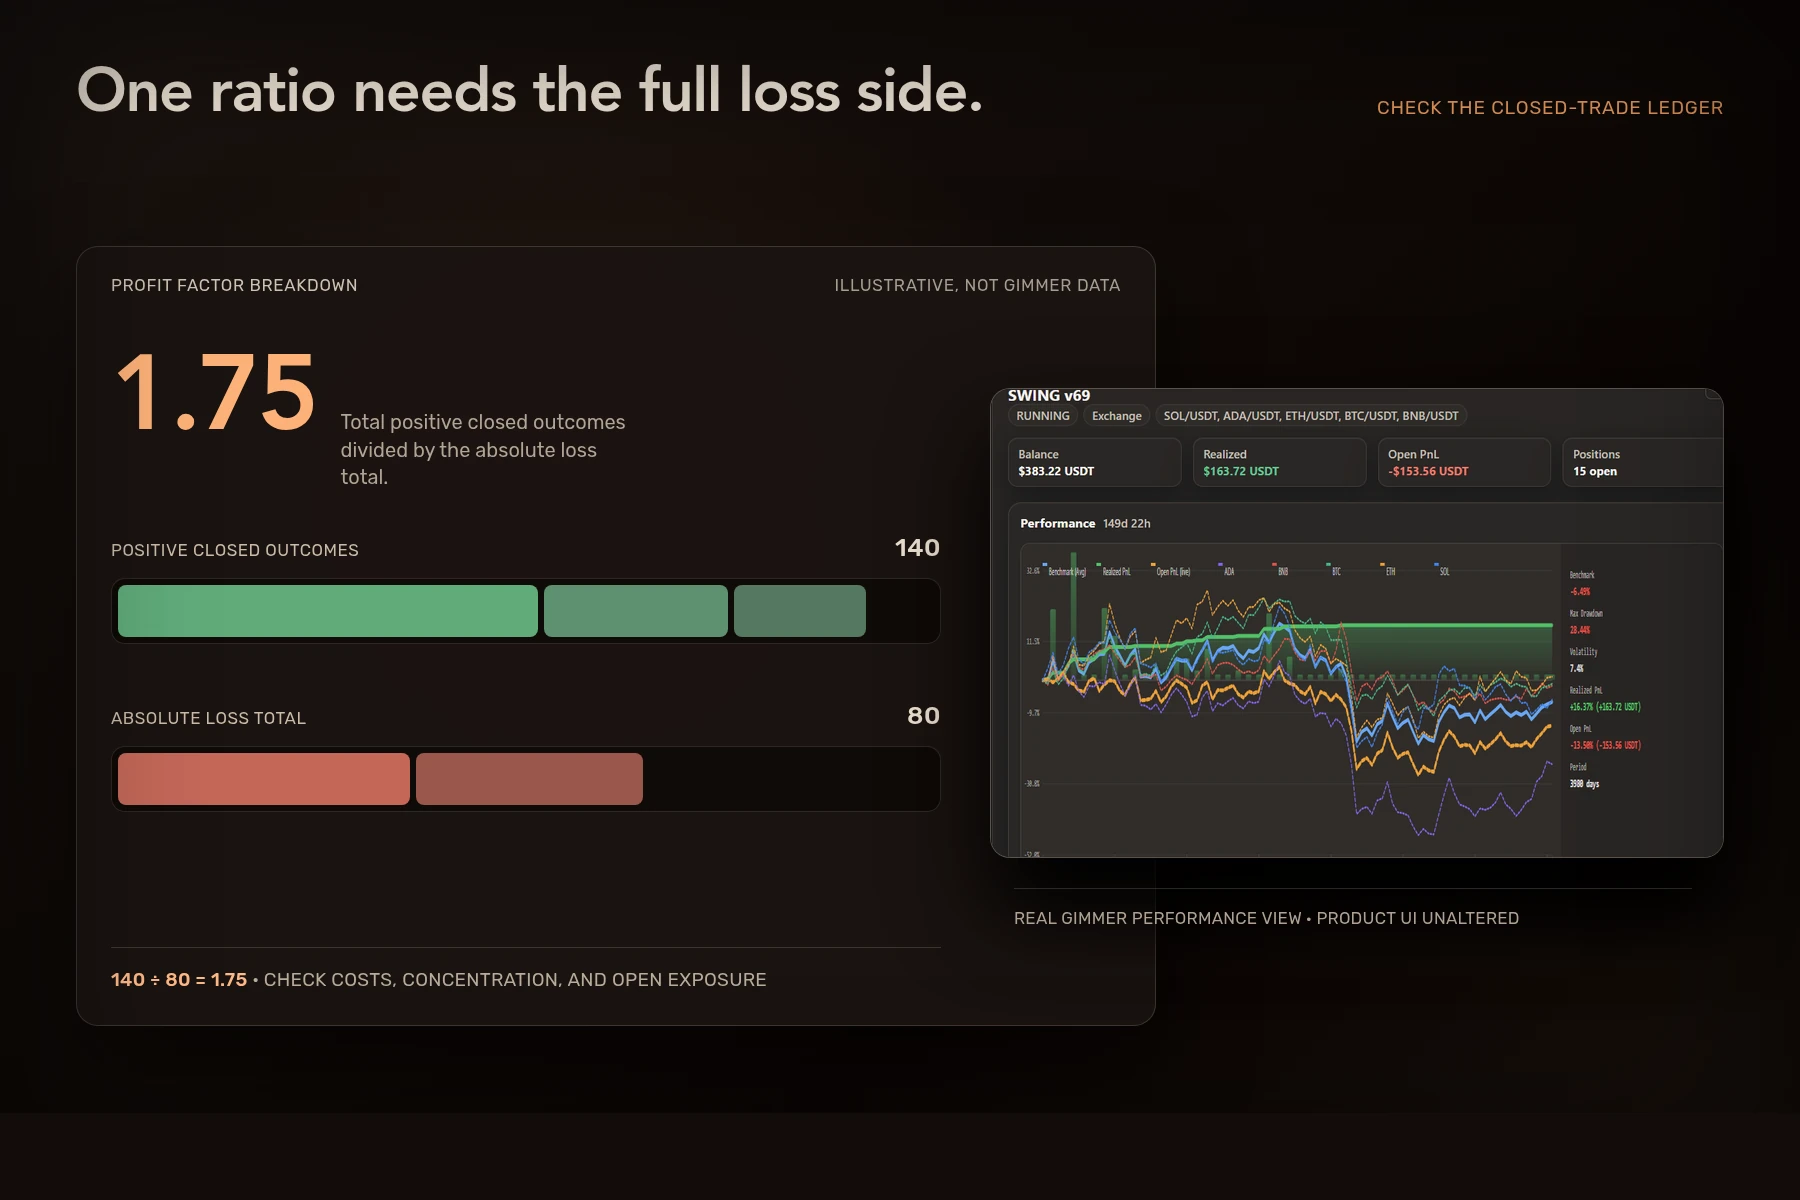
A crypto backtest profit factor compares the total positive results from closed trades with the absolute total of negative results. A value above 1 means the winning side was larger than the losing side inside that historical calculation. It does not show how many trades produced the ratio, whether one outlier dominated it, which costs were included, what remains open, or what will happen next.
How crypto backtest profit factor is calculated
The basic calculation is:
Profit factor = total positive closed-trade results ÷ absolute total negative closed-trade results
Use one consistent trade boundary. If the report calculates the metric from closed positions, do not quietly add unrealized gains to the numerator or remove unsettled losses from the review. If your data source uses orders or fills instead, document that difference before comparing it with another result.
Rebuild the ratio from the ledger
Consider five illustrative closed outcomes in quote currency:
- winning outcomes: +80, +35, and +25;
- losing outcomes: -45 and -35.
The positive total is 140. The loss magnitude is 80. The profit factor is 140 ÷ 80 = 1.75.
These figures are invented to show the arithmetic. They are not Gimmer results, market data, a target, or a recommendation. The useful habit is to reproduce both totals from the same closed-trade ledger used by the report.
Profit factor and win rate answer different questions
Win rate counts how often a closed result was positive. Profit factor compares the money magnitude on the positive and negative sides. Neither replaces the other.
A strategy can win often but give back more in a few large losses. Another can win less often while keeping the total winning side larger. The crypto trading bot win-rate guide shows why the count and average payoff belong beside each other. Profit factor adds another view of that payoff balance, but it still needs the underlying distribution.
Inspect the loss denominator
A large ratio can look reassuring when the total loss side is unusually small. Ask why the denominator is small:
- Did the run contain enough closed losing trades to make the ratio interpretable?
- Did one large win dominate the positive total?
- Did the test end before a currently open position closed?
- Were rejected, cancelled, or partial executions handled consistently?
- Would a small change in dates or costs materially change the ratio?
This is where sample context matters. Use the crypto backtest sample-size checklist to expose the decision count, market coverage, and concentration behind the metric.
Confirm which costs reach each closed outcome
The label “gross profit / gross loss” describes the two accumulated sides of the ratio. It does not, by itself, tell you whether fees, spread, slippage, funding, borrowing, or network costs have already changed each trade result.
Read the report’s metric definition and fee fields, then reconcile a few positions manually. The backtest trading-cost guide separates explicit fees from costs that may sit outside a displayed fee line. Compare two profit factors only when their cost treatment is aligned.
Keep open exposure outside the closed-trade shortcut
Profit factor usually summarizes closed outcomes. An open position can still carry a gain or loss that the ratio does not express. A historical run with a favorable closed-trade ratio and material open exposure needs both facts kept visible.
Gimmer’s public Running Backtest guide directs readers to review the result and saved backtest history while treating historical output as non-predictive. In the current Gimmer Backtest Report, Profit Factor belongs inside a broader review that also includes balances, open exposure, trade counts, risk measures, and the position journal.
Do not turn a historical ratio into a forecast
A precise calculation can still describe a narrow or unrealistic simulation. The CFTC’s trading-system advisory explains that hypothetical results may overestimate or underestimate performance because assumed trades were not exposed to actual market conditions, including liquidity.
That warning does not set a good profit-factor threshold. It explains why no historical ratio should be presented as a promise about future execution or returns.
A seven-step profit-factor checklist
- Choose the exact run. Record the strategy revision, dates, markets, interval, and starting balance.
- Define one closed outcome. State whether the unit is a closed position, order, fill, or another record.
- Reconcile the ledger. Sum positive outcomes and the absolute magnitude of negative outcomes separately.
- Confirm cost treatment. Identify what is included in each outcome and what remains outside it.
- Check concentration. Measure how much of either total comes from the largest trade, market, or short period.
- Review what stays open. Keep unrealized exposure and incomplete records beside the closed-trade ratio.
- Challenge the result. Apply the same calculation to an out-of-sample period after the strategy is locked.
Frequently asked questions
What is a good profit factor for a crypto backtest?
There is no universal threshold. A larger value means the positive side exceeded the loss side by more inside that calculation, but the ratio still depends on the trade boundary, costs, sample, concentration, dates, and open exposure.
Is profit factor the same as win rate?
No. Win rate measures the share of closed outcomes classified as wins. Profit factor compares the total magnitude of positive and negative closed outcomes.
Can two platforms report different profit factors?
Yes. Results can differ when platforms define a trade differently, include different costs, treat partial fills or open positions differently, or use different historical data. Check the metric contract before comparing the numbers.
Make the ratio reproducible
A crypto backtest profit factor is most useful when another reviewer can reconstruct both sides from the ledger and see the conditions around them. Keep the ratio, win-loss mix, costs, open exposure, concentration, and test period together.
For the next review, open Gimmer’s Running Backtest guide, choose one completed run, and rebuild the positive and negative totals from the closed outcomes. Compare that ratio with another run only after the ledger and cost boundaries match, and treat the result as evidence about tested history rather than a forecast.