
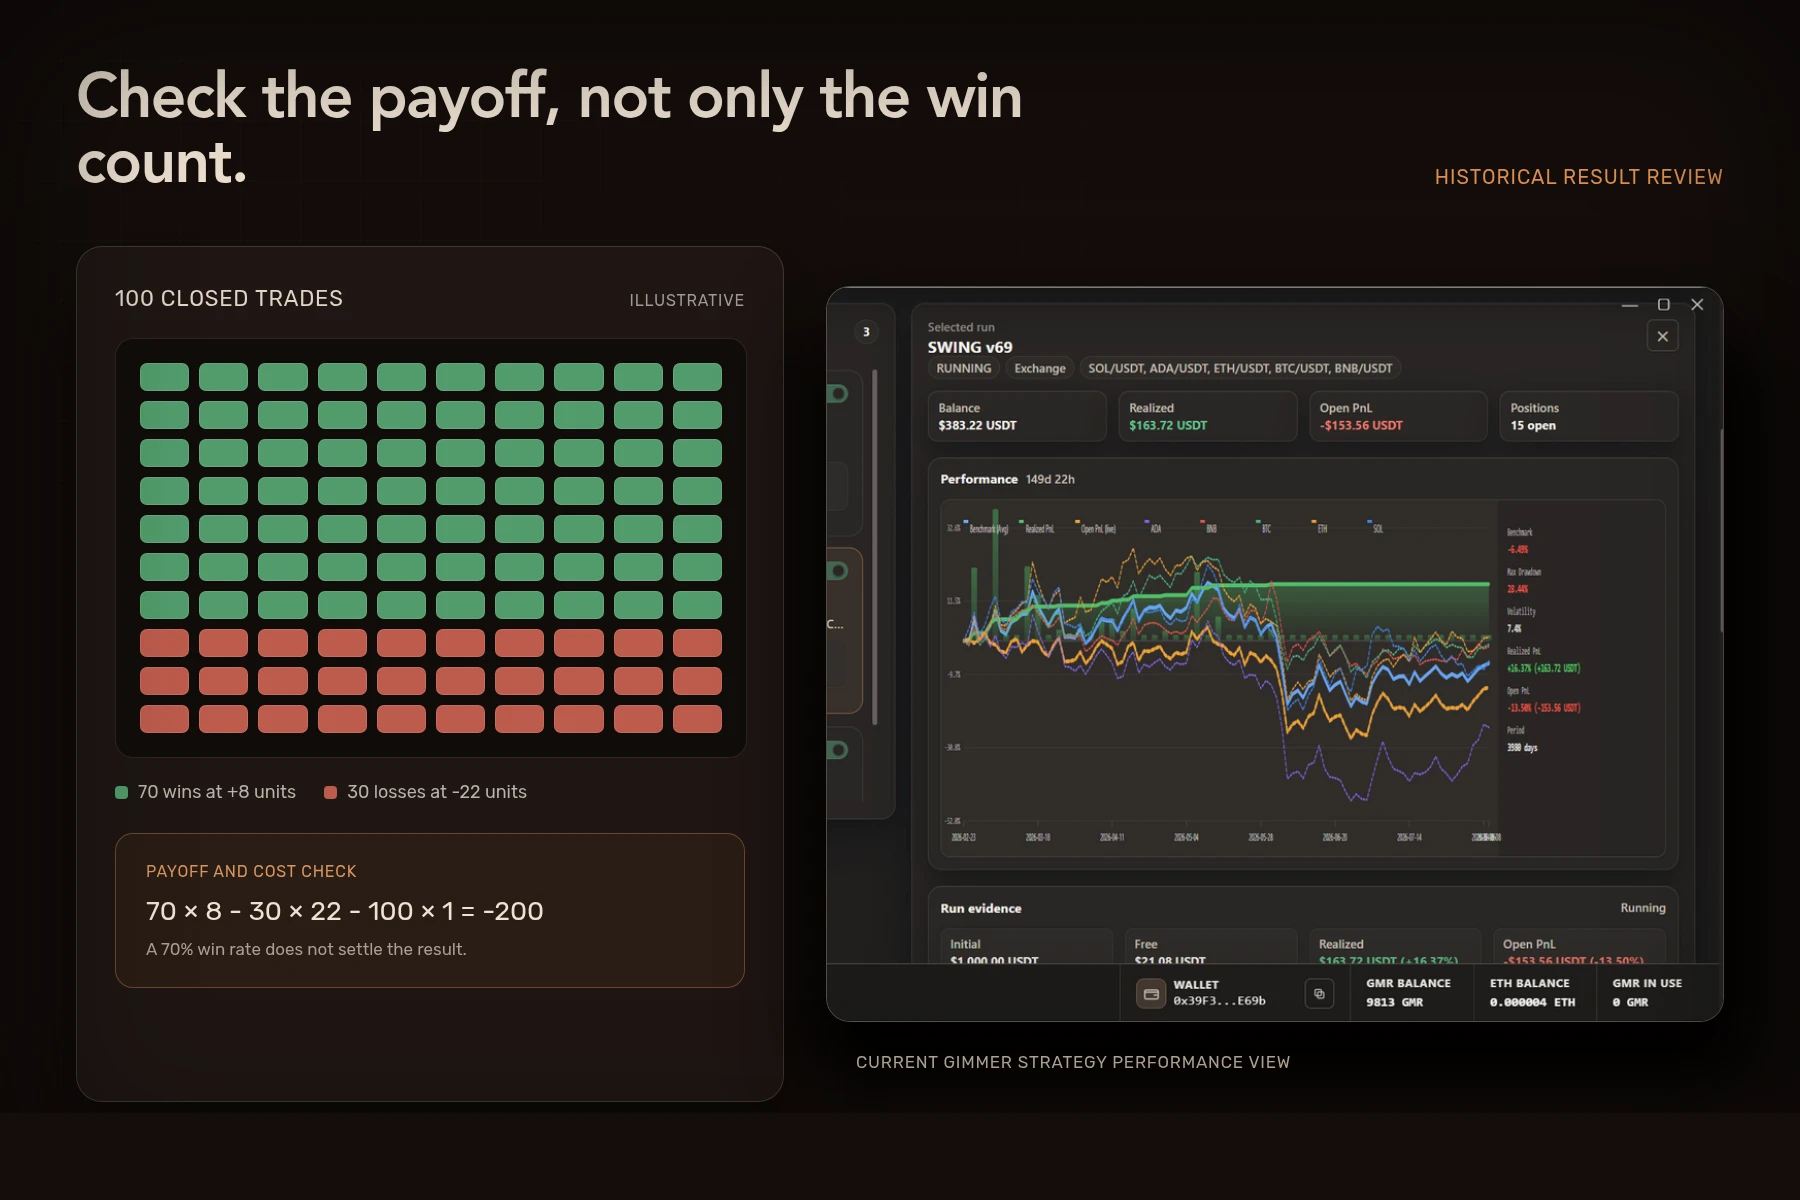
A crypto trading bot win rate tells you how many closed trades were classified as wins. It does not tell you whether those wins were large enough to cover losses and trading costs, how severe the loss path became, or whether the sample represented more than one market condition. Read the percentage beside average win, average loss, costs, trade count, and drawdown before deciding what a backtest means.
What a crypto trading bot win rate measures
The basic calculation is simple:
Win rate = winning closed trades ÷ total closed trades × 100
If 70 of 100 closed trades are wins, the reported win rate is 70%. That percentage describes frequency, not payoff. It also depends on how the report classifies a win, a loss, and a break-even close.
Gimmer’s public Running Backtest guide lists win rate as the share of closed trades classified as wins. The same guide names a common misuse: assuming that more wins automatically mean better expectancy. Keep that boundary visible when you review any historical result.
A 70% win rate can still describe a losing result
Consider an illustrative set of 100 closed trades:
| Input | Illustrative value | Contribution |
|---|---|---|
| Winning trades | 70 at +8 units each | +560 units |
| Losing trades | 30 at -22 units each | -660 units |
| Average trading cost | 100 at -1 unit each | -100 units |
| Historical arithmetic | 70% win rate | -200 units |
The win count looks strong, but the average loss is much larger than the average win. Costs widen the gap. These figures are not Gimmer results, exchange data, or a forecast. They show why a percentage cannot stand alone.
Pair win rate with rough trade expectancy
A compact comparison can expose the missing payoff information:
Rough expectancy per trade = (win rate × average win) – (loss rate × average loss) – average cost per trade
Use one consistent unit, such as quote-currency value or percentage of starting equity. Keep fees, spread, slippage, funding, borrowing, and other relevant costs explicit instead of assuming they disappear inside the win rate. The crypto trading bot fee checklist explains how to separate those assumptions.
This rough equation is a review aid, not a complete market model. Average values can hide extreme losses, partial fills, open exposure, or changing costs. A favorable historical expectancy still does not predict the next trade or later market conditions.
Check the denominator and the classification rule
A win rate from 20 trades and one from 2,000 trades are not equally informative, but a larger sample is not automatically better. The trades must come from relevant, accurate data and a test that did not repeatedly adapt itself to the same history.
Record four details beside the percentage:
- Closed-trade count: State the denominator, not only the rate.
- Break-even treatment: Confirm whether zero or near-zero closes are wins, losses, or a separate class.
- Data boundary: Name the market, interval, dates, candle source, and final-candle rule. Start with the crypto backtest data checklist.
- Trial history: Count the strategy variations tested before this result was selected. The backtest overfitting checklist keeps that search visible.
Read win rate beside the loss path
Two backtests can have the same win rate and a very different risk story. In one, losses may be small and dispersed. In another, a few large losses may cluster together while open positions consume most of the available balance.
Review at least these figures beside win rate:
- average and largest closed win;
- average and largest closed loss;
- realized PnL and open PnL;
- maximum drawdown using a clearly stated equity definition;
- simultaneous positions and capital usage;
- the longest losing sequence and recovery assumptions.
The earlier guide to reading Gimmer backtest results without turning a chart into a promise provides the broader report context. Gimmer’s public risk-controls guide explains why drawdown must include open exposure and why safeguards do not prevent every loss.
Do not optimize for win rate alone
A strategy can raise its win rate by taking small gains frequently while tolerating rare, severe losses. It can also avoid closing a losing position, leaving the open loss outside a closed-trade percentage. Neither pattern becomes safer because the headline number rises.
If an optimizer or manual search ranks a candidate highly, keep the selection objective broad enough to include payoff, drawdown, exposure, costs, and stability across unseen data. A higher win rate is a question to investigate, not a reason to apply a candidate automatically.
A six-question win-rate decision framework
- Count: How many closed trades produced the rate?
- Classification: What exactly counted as a win, loss, or break-even trade?
- Payoff: What were the average and largest wins and losses?
- Costs: Which fees and execution assumptions were included or omitted?
- Loss path: What happened to drawdown, open PnL, and capital usage?
- Validation: Did the behavior remain understandable on relevant unseen data without another round of tuning?
If one answer is missing, mark the interpretation incomplete. Do not fill the gap with the win-rate percentage.
Frequently asked questions
What is a good win rate for a crypto trading bot?
There is no universal good percentage. A lower win rate can accompany larger average wins and controlled losses, while a higher rate can hide rare losses that outweigh many small gains. Costs, drawdown, trade count, and the test boundary determine what the number can support.
Does a high win rate mean a trading bot is profitable?
No. Win rate measures frequency. Profit or loss also depends on payoff size, costs, position sizing, open exposure, and execution assumptions. Historical profitability itself is not a guarantee of a future result.
How many trades are enough to trust a win rate?
There is no magic count. More relevant observations can narrow uncertainty, but duplicated conditions, poor data, hidden parameter search, or one narrow market regime can still make a large sample misleading. Record the count and the conditions that produced it.
Turn the percentage into a review
Win rate becomes useful when it opens a structured review of payoff, costs, sample quality, and the loss path. It becomes dangerous when it closes that review too early.
For the next historical run, open Gimmer’s Running Backtest guide and record win rate, average win, average loss, average cost, trade count, and drawdown in one row before comparing candidates. Treat the result as evidence about the tested history and assumptions, never as a promise about future trading.
Pingback: Crypto Backtest Profit Factor: Check the Ledger Behind the Ratio – Gimmer – Automated Crypto-Trading