
Running a backtest is only half of the job. The calmer part comes after the run finishes, when Gimmer gives you a historical result row and a Backtest Details view where Chart and Report need to be read together before any Report snapshot, Risk view, or Position journal detail gets reduced to one percentage or one pretty curve.
Why Result Reading Deserves Its Own Step
It is easy to treat a completed backtest as if the answer is already obvious. A green percentage looks comforting. A rising curve looks persuasive. A single metric can look decisive if you are already hoping the strategy is ready.
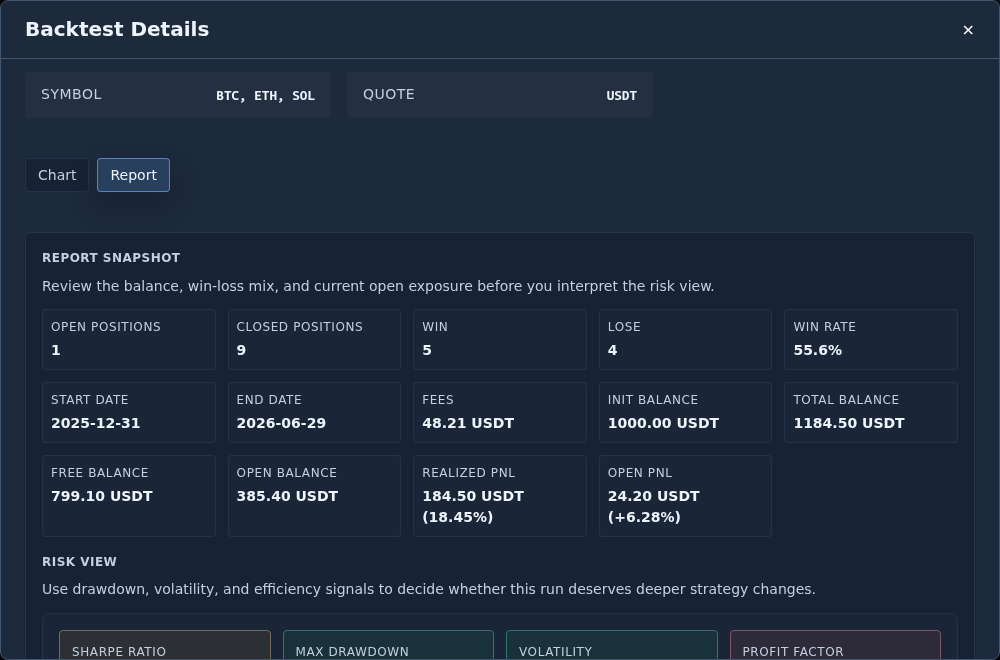
The current Gimmer surface pushes in a more useful direction. Once a saved strategy has historical runs, the Backtest tab lets you open a result row into a details modal with Chart and Report tabs. Inside Report, the current surface includes Report snapshot, Risk view, and Position journal. That combination is more valuable than any single number because it shows what happened, what is still open, what is only partially loaded, and what the route is not proving on its own.
Start With The Historical Row, Not With Memory
The first useful discipline is to begin from the saved historical row rather than from memory.
On the current route, the history list already exposes Test Date, Period, Timeframe, Days, Performance, Base, Quote, and Version. That matters because the right first question is not whether the outcome feels good. The first question is whether you are reading the specific run you actually mean to evaluate.
Open the row you want, then move into Backtest Details. That step narrows the review from a list summary to a full interpretation surface.
Read Chart And Report Together
Inside Backtest Details, the first useful boundary is simple: do not let the chart do all the talking.
The current modal separates the result into Chart and Report. The chart helps you see the run over time, but the report gives the balances, dates, fees, and position counts that tell you what the curve leaves out. If you read one without the other, the interpretation gets thinner than the product surface itself.
This also matters when the route cannot show everything. If historical chart points are unavailable, the current UI can say Chart is not available for this historical backtest. That is not decorative copy. It is a limit you should factor into the review instead of pretending the missing chart does not matter.
Use Report Snapshot As The Factual Core
The Report snapshot section is the best place to ground the review before you move into opinions.
Start with Open Positions and Closed Positions. Then read Win, Lose, and Win Rate as counts and proportions, not as a verdict. After that, read Start Date and End Date so you know what period the run actually covers.
From there, move into the money fields in order: Fees, Init Balance, Total Balance, Free Balance, Open Balance, Realized PnL, and Open PnL. That reading order helps because it separates what the run already closed from what is still open. A result is easier to overread when those categories get flattened into one success story.
Read Risk View As Context, Not As Permission
The next section is useful precisely because it should not be turned into automatic approval.
Gimmer’s current Report tab still includes a Risk view section with labels such as Sharpe Ratio, Max Drawdown, Volatility, Profit Factor, and Drawdown over time. Keep that section in the review because risk still belongs in the conversation, but do not treat the currently shown historical values or drawdown line as a clean approval signal on their own.
What this section does not do is grant live readiness by itself. A calmer-looking drawdown line does not promise that the next market behaves the same way. A stronger profit factor does not turn a backtest into a guarantee. The safer use of this section is to keep risk context in scope, compare it against the rest of the report, and decide what deserves a closer look before you trust the run any further.
Finish With The Position Journal
The Position journal is where the result becomes more concrete.
The current surface lets you switch between Open and Closed positions. That split matters because open exposure and settled trades should not be read as the same kind of evidence. Inside the table, the route gives you Date Open, Date Close, Symbol, Quote Valuation, Quantity, Entry Price, Last Price, PnL %, and PnL ({quote}).
That is the right place to verify whether the result you think you saw in the summary actually matches the positions underneath it. It is also the right place to notice whether the backtest still has open positions affecting the way you interpret the balances above.
Treat Partial Data As A Product Boundary
Not every run detail arrives in one perfect view, and the route already tells you that.
When more position pages exist, the UI can expose Load more positions. It can also show the note Showing the latest positions. Open the backtest history for the full list. That means the right reading habit is not to assume the visible table is always the full ledger. The right habit is to read the current page as the current page and decide whether you need more before drawing conclusions.
That same discipline applies to chart availability, open-versus-closed filters, and any section that is visibly partial. Good operator review is not about pretending the surface is more complete than it is. It is about taking the visible limits seriously.
What This Result Does Not Prove
A completed backtest result is useful, but it is not a shortcut to certainty.
It does not prove future live returns. It does not prove that one attractive curve means the strategy is ready. It does not prove that a positive Realized PnL or Open PnL should survive the next market regime. It does not prove that any one threshold for drawdown, volatility, Sharpe Ratio, or profit factor should be treated as universal.
What it does provide is something quieter and more useful: a current surface for reading how this run behaved, what stayed open, what got closed, what fees took away, and what needs a deeper look before the next decision.
A Practical Backtest-Review Routine
A conservative routine in the current route looks like this:
- Open a saved strategy’s Backtest tab and choose the exact historical row you want to review.
- Open Backtest Details and compare Chart with Report instead of letting one view carry the whole interpretation.
- Read Report snapshot in order: counts, dates, fees, balances, realized PnL, then open PnL.
- Use the Risk view section to keep risk context in scope, not as a standalone approval screen.
- Finish with the Position journal so open versus closed exposure stays visible.
- If chart or position data is partial, treat that as a real review limit before you change the strategy.
That routine is intentionally slower than hype copy. It keeps the next move anchored to what the route is actually proving.
Final Thoughts
The best use of a backtest result is not excitement. It is better judgment.
In Gimmer, the current result surface already gives you a better reading order than a single headline number: chart first for shape, report snapshot for balances and dates, risk as context you keep in scope without overclaiming, and positions for the underlying record. Use all four together, and let the visible limits of the route shape what you claim the run actually proved.
Open a saved strategy’s Backtest tab, choose the historical row you want, compare Chart with Report, then use Report snapshot, Risk view, and Position journal to decide what to inspect next before you change the strategy.
— The Gimmer Team
Pingback: Crypto Backtest Benchmark: Compare Like With Like – Gimmer – Automated Crypto-Trading