
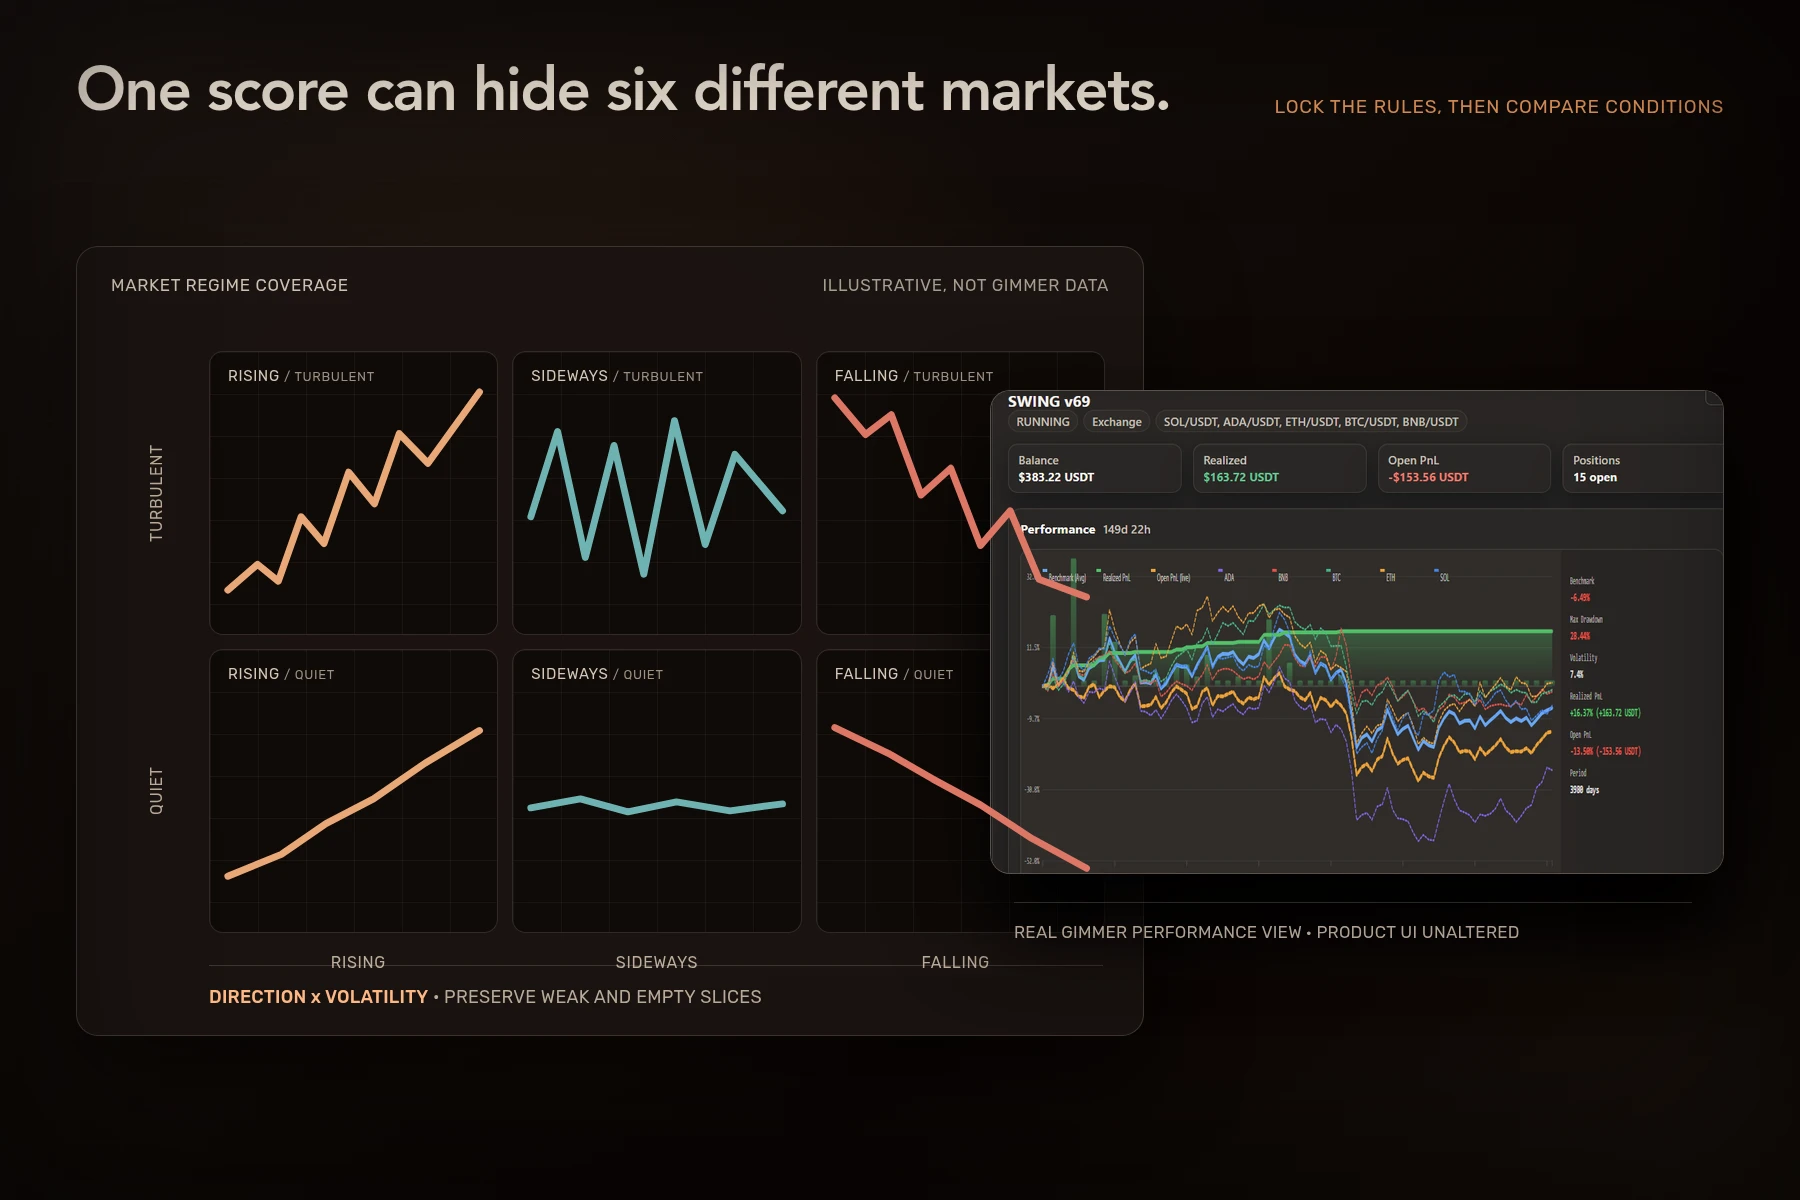
A crypto backtest market regimes review asks one practical question: does the same locked strategy behave differently in rising, falling, sideways, quiet, and turbulent periods? Define those conditions before you inspect the outcomes, run the same rules across each selected slice, and compare execution evidence rather than one aggregate score. The result is a coverage map, not a forecast.
What market regimes mean in a crypto backtest
A market regime is a period grouped by a declared set of observable conditions. Direction and volatility are useful starting points, but they answer different questions. A market can rise calmly, rise turbulently, fall calmly, or fall turbulently. Calling all four periods simply bullish or bearish hides that difference.
Research by Andrew Ang and Allan Timmermann describes how financial-market behavior can change abruptly and persist, with estimated means, volatilities, autocorrelations, and cross-covariances differing across regimes. Their NBER paper on regime changes and financial markets supports that general concept. It does not define a crypto trading rule, endorse Gimmer, or make a particular classification correct.
Gimmer’s public guidance recommends choosing a meaningful historical date range that includes rising, falling, sideways, high-volatility, and low-volatility periods where data exists. This article turns that guidance into a repeatable review method. It does not claim that Gimmer automatically detects or labels regimes.
Define regimes before viewing the result
If you name a period after seeing that it helped or hurt the strategy, the label can become another way to explain away an inconvenient result. Write the classification rule first, keep it fixed, and record where the data came from.
Axis 1: direction
Choose one rule for rising, falling, and sideways periods. The rule could use a fixed return boundary, a price relative to a declared trend measure, or another reproducible definition. The important point is not which rule sounds sophisticated. It is whether another reviewer can apply the same rule without seeing the strategy outcome.
Axis 2: volatility
Separately classify each period as quiet, typical, or turbulent using one predeclared measure and interval. Do not let a large positive move become a synonym for high volatility or a flat ending price become a synonym for a quiet path. Volatility describes variation along the way, not direction.
Freeze the boundary
Record the indicator, lookback, threshold, timezone, candle interval, and effective dates. Calculate classifications using only information available at each historical point. The look-ahead bias audit explains why a future candle, later revision, or full-sample threshold must not leak into an earlier decision.
Prepare one locked strategy revision
Regime comparison is useful only when the strategy itself stays constant. Save the engine, market, interval, position rules, risk settings, initial balance, costs, and revision identifier before you run the slices. If you change a parameter after every weak segment, you are no longer comparing one strategy across conditions.
Check the historical series first. Missing candles, duplicate timestamps, a still-open final candle, or mismatched timezones can create an apparent regime change that came from the dataset. Use the crypto backtest data checklist before interpreting the condition map.
Build a two-axis regime coverage map
Start with a small grid. Put direction on one axis and volatility on the other. Assign non-overlapping historical slices to the cells, then run the same saved revision across every slice that has adequate data. Preserve empty cells instead of quietly removing them.
The table below is illustrative. Its values are invented test units, not Gimmer, exchange, or cryptocurrency market data.
| Historical slice | Direction | Volatility | Closed decisions | Net change | Largest decline | Review question |
|---|---|---|---|---|---|---|
| A | Rising | Typical | 18 | +9 units | 6 units | Did many small outcomes or one event drive the result? |
| B | Sideways | Quiet | 6 | -1 unit | 2 units | Was the strategy inactive, selective, or unable to find its setup? |
| C | Falling | Turbulent | 12 | -11 units | 14 units | Did sizing, exits, or open exposure amplify the loss path? |
| D | Rising | Turbulent | 9 | +4 units | 10 units | Did the ending value hide an unstable path? |
Do not rank these rows by net change alone. Compare trade count, realized and open exposure, costs, drawdown, order behavior, and concentration. The sample-size review helps distinguish a broad slice from one dominated by a few decisions.
Read condition differences without inventing a forecast
A weak slice is not automatically a defect, and a strong slice is not proof of an edge. First ask whether the result is internally coherent with the rules. A trend-following idea may trade rarely in quiet sideways conditions. A faster strategy may produce more decisions and more cost sensitivity in turbulent periods. Those are hypotheses to inspect, not permissions to remove unfavorable history.
- Check coverage: Do all material cells contain enough time and decisions to interpret?
- Check concentration: Does one day, trade, market, or large move own most of a slice?
- Check execution: Are fees, spread, slippage, order behavior, and open positions treated consistently?
- Check risk: Does a similar ending value hide a very different drawdown path?
- Check comparability: Are starting value, quote currency, interval, and measurement method aligned?
Use the benchmark comparison guide when a passive market path is part of the review. A strategy slice and its benchmark still need the same dates, costs, capital boundary, and currency.
Keep one period outside the regime-tuning loop
Once the condition map has influenced parameter choices, those same slices no longer provide a clean final check. Preserve a later or otherwise unseen period, apply the frozen classification rule, and evaluate the selected strategy revision once. The out-of-sample backtesting workflow explains how to separate selection evidence from evaluation evidence.
If the unseen period contains a regime absent from the earlier sample, say so. That gap is useful information. It does not become permission to invent a synthetic success case or claim the strategy will adapt automatically.
A crypto backtest market regimes checklist
- Write the direction and volatility definitions before reading outcomes.
- Record the data source, interval, timezone, lookback, thresholds, and effective dates.
- Verify candle completeness and prevent future information from entering a label.
- Save one strategy revision with unchanged execution, sizing, risk, and cost assumptions.
- Assign non-overlapping historical slices to the two-axis map.
- Run every adequately supported cell and preserve weak or empty cells.
- Compare trades, costs, exposure, drawdown, concentration, and order behavior.
- Keep an unseen period outside the classification-and-tuning loop.
Crypto backtest market regimes FAQ
Does Gimmer automatically identify market regimes?
This guide makes no such claim. It uses Gimmer’s public date-range backtest workflow and its instruction to include different direction and volatility conditions. The regime map is a manual review framework.
How many market regimes should a backtest use?
There is no universal number. Start with the smallest set that answers the strategy question without mixing direction and volatility. Add another category only when its rule is reproducible and the historical data can support a meaningful comparison.
Can a strong result in one regime validate a strategy?
No. It can identify a condition-specific hypothesis worth further testing. It cannot show that the same behavior will persist, that the classification is stable, or that live orders will match a historical simulation.
Make the next run answer a condition question
One aggregate backtest can hide very different paths. A predeclared regime map keeps those differences visible without pretending the labels predict what comes next. Open Gimmer’s Running Backtest guide, write the two-axis coverage map, then run one saved strategy revision across the selected historical slices.