
Repeated runtime errors create two opposite risks. You can treat every line as a separate incident, or you can see one repeated message and assume every occurrence has the same root cause. A grouped-error view helps only when you avoid both conclusions.
This article explains how to use Gimmer’s recent runtime error groups before opening a distributed trace. The workflow is currently part of the development-only observability surface. It is not a promise of production availability, automated root-cause detection, or complete incident evidence.
The goal is smaller and more useful: turn a noisy set of runtime errors into one focused diagnostic question.
Start With The Scope Of The Surface
Gimmer’s observability workspace brings runtime metrics, recent issues, and distributed traces into one technical review context. In the current product, the advanced error and trace panels are development-only.
That boundary matters. A development operator can use the surface to inspect the application errors and captured traces actually returned by that local runtime. A public reader should not interpret the same workflow as a guarantee that every production user has access to a complete incident console.
Use the page as a diagnostic aid. Keep the conclusion proportional to the evidence it actually shows.
What Gimmer Groups Together
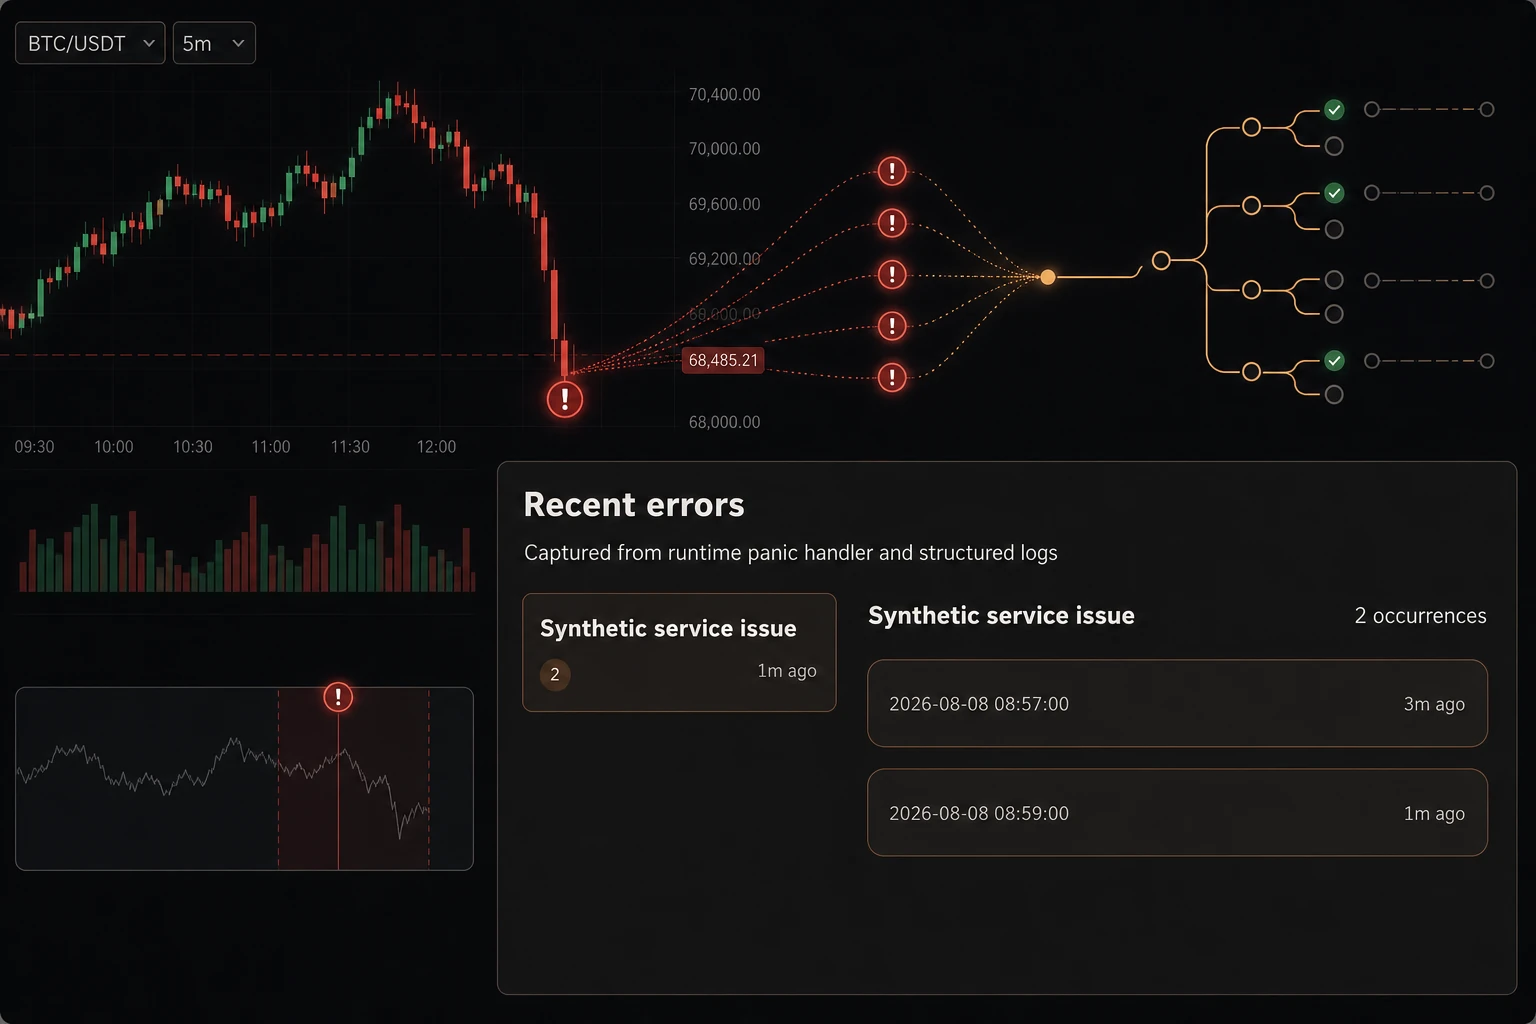
The Recent errors section groups the stored error entries returned by the current response by their message and, when a numeric status is present, that status. The group list then shows the message, the occurrence count, and how recently the latest entry appeared.
This is useful display grouping. It reduces repetition and makes recurrence easier to see. It is not causal clustering.
Two entries with the same message can still come from different conditions. Two different messages can still share an upstream cause. A count tells you how many entries were returned in the current recent-error response for the current group, not how many users were affected, how severe the problem is, or how large an incident has become.
That distinction should guide every step that follows.
Read The Group Label, Count, And Time Separately
Each visible signal answers a different question:
- Message: What wording did these grouped entries share?
- Numeric status, when captured: It can affect the grouping key, but the group list does not display it as a separate label. Inspect the selected entry’s structured context when it is available.
- Count: How many entries returned in the current recent-error response are represented in the current group?
- Latest time: When did the most recent represented entry appear?
Do not collapse those fields into a severity score. A recent group is not automatically the most important. A larger group is not automatically the most damaging. An older group is not automatically resolved.
Instead, use the signals to decide which group best matches the operational question already in front of you.
Open One Group Before You Open A Trace
Selecting a group reveals the individual entries it currently contains. An entry can include an absolute timestamp, a relative time, a stack, and structured context when those fields were captured.
Read only the fields needed inside the authorized development workspace. Compare another entry when the group contains multiple occurrences, but keep raw stacks and context internal. If evidence leaves the workspace, use a sanitized summary of allowlisted synthetic fields, not a copied log payload.
Some entries will contain less detail than others. The absence of a stack, status, or context field does not prove that nothing happened. It means the current entry does not provide that field for your review.
Keep raw runtime details inside the authorized development workspace. Do not copy or publish raw error messages, stacks, structured context, trace or span IDs, internal routes or hostnames, code paths, request, user, or account identifiers, exchange credentials, wallet or transaction data, headers, cookies, or tokens. For a public screenshot or support artifact, use a deterministic synthetic fixture and share only an allowlisted summary through an approved internal channel. Do not sanitize a live log by hand and assume it is safe.
Turn The Group Into A Diagnostic Question
Before moving to distributed tracing, write one question the trace could reasonably help answer.
Useful questions are narrow:
- Which service handled the runtime path near this error window?
- Did a related captured trace include an error span?
- Which operation or exchange context appears in the relevant trace summary?
- Does the trace timing align with the selected error entry?
- Which logs, metrics, or activity records still need to be checked afterward?
Avoid questions that ask the trace to prove too much. One trace cannot certify platform health, explain every occurrence in a group, confirm wallet or blockchain transaction state, validate a crypto trading strategy, or guarantee exchange availability.
Use Distributed Traces As A Separate Evidence Source
In the current observability workflow, recent error groups and distributed traces are separate panels. The trace list can be filtered by service, exchange, and root-span name, but the current surface should not be read as automatic error-to-trace correlation.
That means the operator still has work to do. Use the error message, timing, and an approved, sanitized summary of non-sensitive fields to choose a relevant filter. Then inspect a candidate trace only if its service, operation, exchange context, or time window matches the question you defined.
A matching trace adds scoped evidence. It does not convert the whole error group into one proven incident. If the trace is unrelated, return to the group and refine the question instead of forcing a connection.
Handle Empty And Error States Conservatively
The recent-errors section can show loading, error, and empty states. Each state has a narrow meaning.
No errors recorded means the current response did not provide stored error entries for the view. It does not prove that every service, exchange connection, crypto bot, wallet workflow, or blockchain operation is healthy.
A loading failure means the panel could not provide the expected evidence at that moment. It is not evidence that the underlying runtime is healthy or unhealthy. Record the missing signal as a sanitized note in an approved internal channel and use another approved operational source while the error view is unavailable. Never attach raw responses, stacks, context, headers, cookies, tokens, or credentials to an article, screenshot, or support artifact.
A Practical Pre-Trace Routine
- Confirm that you are working in the development-only observability surface from an authorized workspace.
- Choose the error group that matches your current operational question.
- Read the message, count, and latest time as separate signals.
- Inspect at least one recent entry and compare another entry when the group contains multiple occurrences.
- Keep raw stack and context inside the authorized workspace; for shared evidence, use a synthetic fixture or a sanitized allowlisted summary.
- Write one narrow question that a distributed trace could help answer.
- Filter traces by service, exchange, or root-span name only when the available evidence supports that filter.
- Use the selected trace as one more clue, then confirm the broader story with approved internal metrics, logs, route behavior, strategy activity, exchange response context, and other evidence. Do not copy raw logs or customer data into public or support material.
This routine keeps runtime error grouping useful without turning repetition into certainty.
What An Error Group Does Not Prove
- It does not prove one root cause.
- It does not measure incident severity by itself.
- It does not prove how many users or trading workflows were affected.
- It does not guarantee that every related entry was captured.
- It does not automatically identify a matching OpenTelemetry trace.
- It does not certify exchange, wallet, blockchain, API, or crypto bot health.
- It does not replace Product, CTO, Security, or QA review.
Those limits are not weaknesses to hide. They are the boundaries that make the evidence safe to use.
Final Thoughts
Good observability work starts by resisting an easy story. Repetition is a signal, but it is not a conclusion.
Gimmer’s grouped recent-errors view can help a development operator reduce noise, compare occurrences, and define a more useful trace question. Read the group carefully, protect sensitive context, and open a distributed trace only when you know what evidence you are looking for.
Start with one recent error group inside an authorized workspace, record only what its message, count, and timing support plus a sanitized summary of allowlisted fields, then open a relevant trace only when you have a specific question the trace can help answer.
– The Gimmer Team