
Renting from a marketplace gets weaker when one attractive ROI number does all the work. In Gimmer, the calmer habit is slower: open Traders, compare the visible risk band, displayed Win rate, bot count, and Max DD on the list, then open Trader profile and inspect the Performance curve plus Marketplace bots before you decide whether a rental deserves deeper review.
Start On The List, Not On One Headline Number
The current Traders route is most useful when you treat it as a comparison surface instead of a shortcut to a decision. The list gives you several visible signals at once: a risk band, ROI, displayed Win rate, bot count, and a Max DD caption.
That matters because marketplace decisions often go wrong when one flattering number becomes the whole story. A strong ROI can be useful context, but it should sit beside the visible drawdown and risk band, not above them. If two profiles look similar on ROI but one carries a very different Max DD or risk label, that difference should change whether the profile deserves more of your attention.
The route already points in that direction. Its comparison language and section structure encourage a slower read before a rental decision. Use that structure. Let the list narrow the field before the detail page tries to confirm anything.
Traders is a comparison surface, not a performance guarantee. High ROI or high rental activity may explain why a profile gets attention, but they do not prove that a trader or bot matches your own risk tolerance.
Let Max DD Narrow The Field First
One of the most useful visible labels on the list is Max DD. It is easy to skip when ROI is louder, but it is often the better first filter.
The practical reason is simple: a profile can look interesting on return while still sitting outside the drawdown range you are willing to tolerate. The current route cannot promise a future loss ceiling, and the article should not pretend that it can. What it can do is show a historical drawdown label that helps you decide whether a profile belongs in your review pile at all.
That makes Max DD useful before deeper review, not after. If the drawdown already looks wrong for your own rules, it is better to know that before you open the detail page and start talking yourself into a decision because the ROI still looks exciting.
Use Trader Profile To Slow The Decision Down
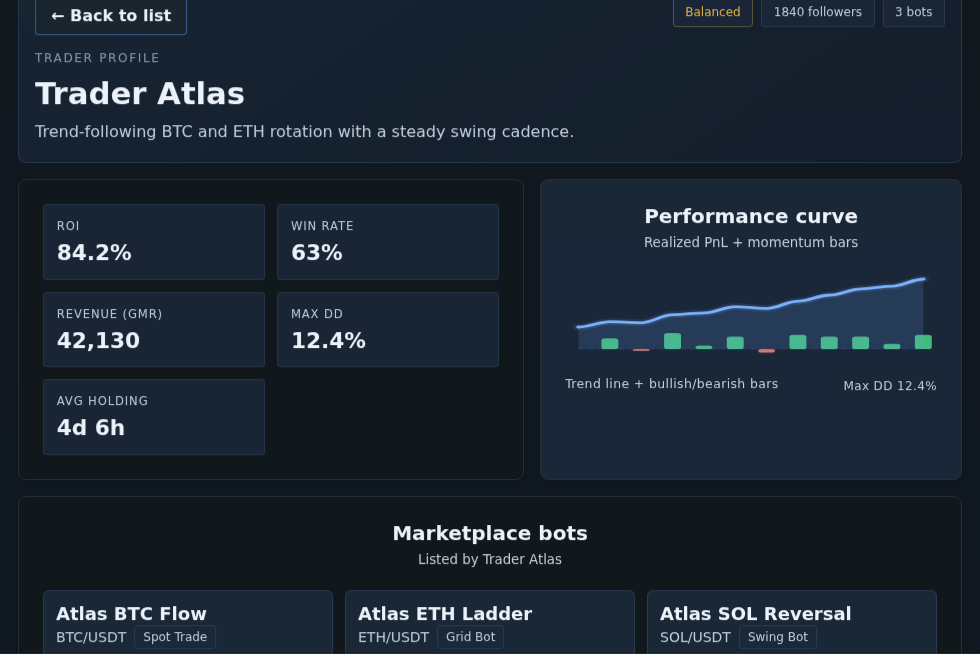
Once the list narrows the field, open Trader profile. This is where the route gives you a fuller reading surface: the current risk label, summary tiles, the Performance curve, and the Marketplace bots section.
The right goal here is not to look for confirmation of a rental you already want to make. The right goal is to see whether the detail view still supports the interest the list created. If the list looked promising only because of one headline number, the profile view should help you notice that before you rent.
The visible Win rate label can contribute to that review, but it should stay in conservative context. Treat it as a current on-page label, not as a promise of trade-by-trade accuracy. The same is true for the Performance curve. It is useful as a visible chart that helps you compare steadiness and shape, but it is not proof of future behavior and not a complete promise about how the trader will perform after rental.
The safest reading order is simple: check the risk label, scan the summary tiles, inspect the Performance curve, and only then decide whether the profile still deserves deeper attention.
Read Marketplace Bots As Current Listings, Not Endorsements
The Marketplace bots section is where the profile becomes concrete. It shows which bot listings are currently associated with that trader and gives you a bridge from profile review into a specific bot page.
That section is useful because it helps you see scope, concentration, and current listing context. Are there multiple bots visible? Do the listings appear concentrated around one style or spread across different pairs and types? Does the trader profile lead into a focused set of marketplace options, or into a broader set that may need more filtering on your side?
You can also read the visible ROI and Rentals labels in this section as current marketplace context. What you should not do is turn rental activity into proof that a bot is right for you. Activity can tell you that a listing is getting attention. It cannot replace your own judgment about risk tolerance, drawdown, and whether the current route evidence still looks acceptable when read together.
Keep Activity Signals In Context
Marketplace routes often contain signals that feel like social proof. The safe habit is to keep those signals behind the more fundamental questions.
Does the visible risk band already fit your tolerance? Does the displayed Max DD still look acceptable? Does the profile still make sense when you stop reading ROI as a forecast and start reading it as one current historical label among several?
If the answer depends too heavily on a rising chart shape, a large ROI, or a busy-looking rental count, that is usually a sign to slow down rather than to rent faster. A better public reading of this route is that it helps you compare the evidence Gimmer currently exposes before you commit to a rental decision.
A Practical Pre-Rental Reading Routine
A short routine keeps the route useful without turning it into a promise surface:
- Open Traders and compare the visible risk band, displayed Win rate, bot count, and Max DD before you read too much into ROI.
- Use ROI as displayed historical context, not as a forecast of what will happen after rental.
- Open Trader profile and inspect the risk label, summary tiles, Performance curve, and Marketplace bots together.
- Read visible Rentals as current activity, not as proof of trustworthiness or fit.
- If your confidence depends on one number or one chart direction, stop and re-read the route as a comparison surface instead of a guarantee.
- Only continue into a bot detail page if the combined picture still fits your own rental rules.
Final Thoughts
The value of Gimmer’s Traders route is not that it tells you who will perform best. The value is that it gives you a calmer way to compare what is visible now before you rent anything.
That is enough to improve the first decision. Read the list first. Use Trader profile to slow the decision down. Treat Performance curve, ROI, and Rentals as current route evidence, not as promises about what comes next.
Open Gimmer, go to Traders, start with the risk band, displayed Win rate, and Max DD on the list, open Trader profile, inspect the Performance curve and Marketplace bots, then decide whether the profile matches your own rental criteria before you rent.
— The Gimmer Team