
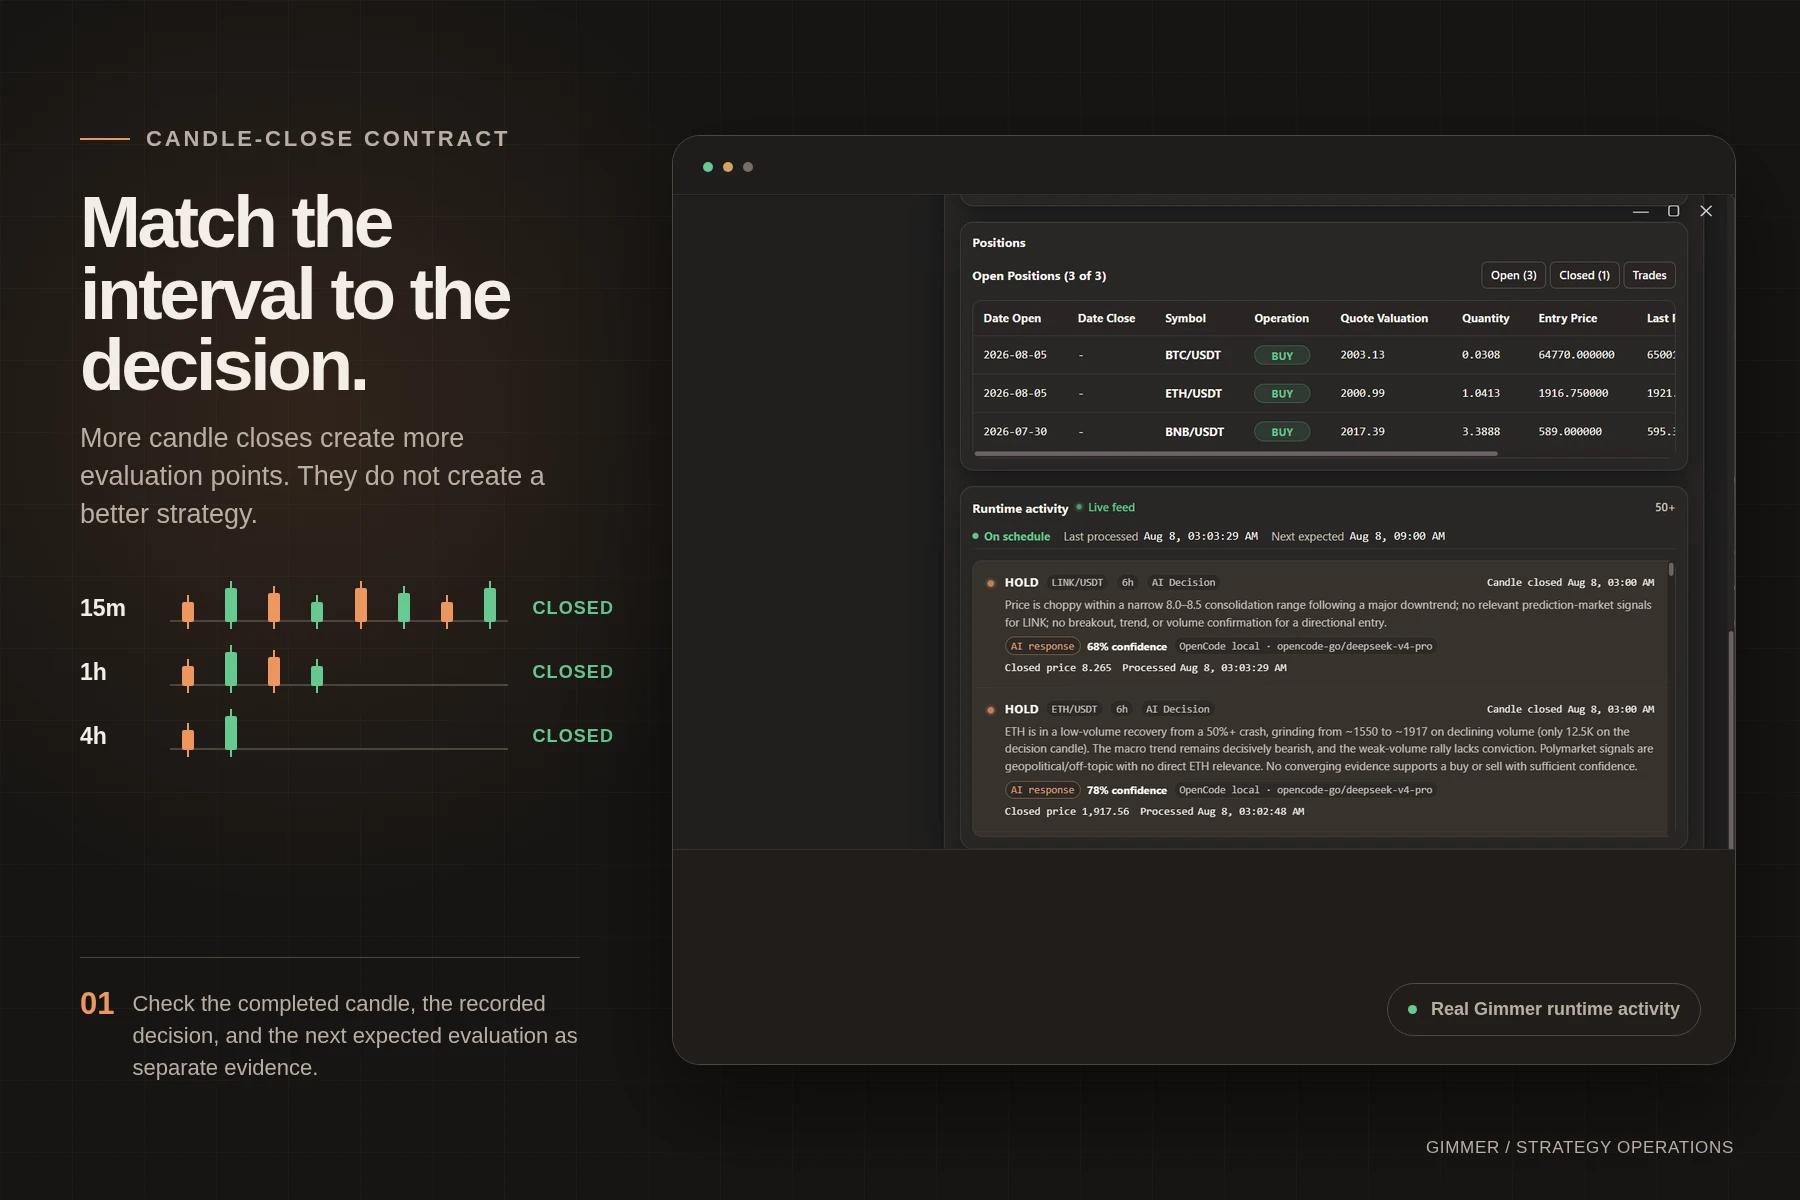
Crypto trading bot timeframes determine how market activity is grouped into candles and when a strategy can evaluate completed data. A shorter interval creates more candle closes, not a better strategy. Choose the interval that matches the market question, record exactly when a candle is final, include the resulting data and cost burden, and lock that choice before you read a backtest.
Gimmer’s Create a Strategy guide uses the same practical boundary: decisions are evaluated from closed candles at the selected interval, and shorter intervals increase evaluation and potential execution frequency.
What a crypto trading bot timeframe controls
A candle interval is a data rule. It groups trades into open, high, low, close, and volume observations for a defined span. The strategy then applies its logic to that sequence.
The interval does not set a guaranteed holding period. A rule evaluated on four-hour candles might hold a position for one candle, several days, or never open one. It also does not guarantee that an evaluation becomes an order or that an order fills.
| Clock | Question it answers | Common mistake |
|---|---|---|
| Candle clock | When does the selected data bucket start and finish? | Using a still-forming candle as if its close were final. |
| Decision clock | Which completed candle is the strategy allowed to evaluate? | Assuming every price update creates a new decision. |
| Execution clock | When did an instruction reach a venue and reach a final state? | Treating signal time, submission time, and fill time as identical. |
| Monitoring clock | When should the next evaluation appear in runtime activity? | Calling a feed stale before the configured candle should close. |
Start with the market question, not a popular interval
Write down what the strategy is trying to observe and how quickly that condition can reasonably change. A rule about movement inside a trading session asks a different question from a rule about a multi-day trend. Choosing the interval first and inventing the thesis later invites parameter chasing.
Name the observation horizon
State the period over which the condition should become meaningful. Then choose a candle interval that provides enough completed observations without pretending that every small price change deserves a reaction.
Attach every lookback to its interval
A 20-candle window represents five hours on 15-minute candles, 20 hours on one-hour candles, and more than three days on four-hour candles. “Period 20” is incomplete unless the interval is recorded beside it.
Define the completed-candle rule
The current Gimmer Indicators reference describes completed-candle evaluation. That boundary prevents a strategy from quietly using a close, high, low, or volume value that can still change before the bucket finishes.
Shorter candles create a larger operating burden
Shorter intervals produce more candles across the same date range. That means more data to retrieve and validate, more evaluations to observe, and potentially more opportunities for orders and costs. It does not mean the strategy will trade on every candle.
Coinbase’s official Product Candles documentation defines granularity as the timeframe represented by each candle and returns the candle start plus open, high, low, close, and volume fields. This is general market-data evidence, not a claim that Gimmer supports a particular Coinbase product or interval.
Consider one 24-hour period. These are arithmetic examples, not Gimmer output, venue output, or recommendations:
| Illustrative interval | Completed candles per 24 hours | Operating question |
|---|---|---|
| 15 minutes | 96 | Can data, costs, and monitoring support this many expected evaluations? |
| 1 hour | 24 | Does each candle still match the intended decision horizon? |
| 4 hours | 6 | Will the test include enough completed observations and regimes? |
| 1 day | 1 | Which timezone and data-source boundary defines the daily close? |
Verify current interval availability for the selected market and data source. Do not treat this comparison as an availability list.
Use a seven-field timeframe decision card
Before backtesting, record one compact contract:
- Market question: What condition is the strategy trying to observe?
- Candle interval: How is market activity grouped?
- Close boundary: Which timezone and source define a completed candle?
- Lookback span: How many candles and how much elapsed time does each rule use?
- Cost model: How could fees, spread, slippage, funding, or borrowing change with frequency?
- Expected activity: When should the next evaluation appear, even if the action is hold?
- Validation plan: Which locked dates and later unseen period will challenge the revision?
The earlier crypto backtest data checklist helps verify source, range, expected candle grid, gaps, and the final-candle rule. The crypto trading bot fee checklist keeps explicit fees separate from spread, slippage, and other modeled costs.
Compare timeframes without changing everything else
A clean comparison changes the interval and the minimum rules required to preserve the same market question. It does not retune dozens of parameters independently until each interval produces an attractive historical curve.
- Save the strategy revision and the timeframe decision card.
- Choose a meaningful historical range with different market conditions.
- Confirm complete candles and exclude any still-forming final bucket.
- Run one locked base case and record trade count, costs, open exposure, drawdown, and failures.
- If comparing another interval, document how every lookback’s elapsed span changes.
- Challenge the selected revision on dates that did not choose it.
Use Gimmer’s Running Backtest guide to read the report as a system. A higher trade count or smoother curve on one interval is not enough to approve it.
Monitor the expected candle, not the number of trades
A strategy can evaluate a completed candle and correctly decide to hold. That is different from missing the evaluation entirely.
The Simulation and Live guide tells operators to compare runtime activity with the configured interval, closed-candle time, and timezone. In simulation, leave the saved revision running through expected candle closes and confirm that the feed advances. Investigate a missing expected evaluation even when no trade signal was expected.
If a feed appears old, first ask whether the selected candle should have closed. Then check the recorded interval, market, saved configuration, system time, connectivity, sleep state, and runtime errors. Do not retry an order merely because an interface has not yet shown the state you expected.
Multi-timeframe logic needs an explicit data boundary
A strategy may use one interval for context and another for decisions, but each input still needs a completed-candle rule. At 10:30, a four-hour candle scheduled to finish at 12:00 is not final evidence. Define which completed higher-timeframe candle is available to the lower-timeframe decision.
Also record how missing candles, venue timestamps, clock changes, and data gaps are handled. Otherwise the backtest and later simulation can appear to share a rule while reading different information.
Crypto trading bot timeframe FAQ
What is the best timeframe for a crypto trading bot?
There is no universal best interval. Choose one that matches the market question, available data, cost tolerance, and monitoring capacity. Then test a locked revision across varied and unseen historical periods.
Does a shorter timeframe make a bot trade more?
It creates more possible evaluation points. The actual number of trades still depends on the strategy rules, market data, risk controls, and execution state. More opportunities are not the same as better results.
Can I change the timeframe after a backtest?
Yes, but treat it as a new strategy revision. The elapsed span of each lookback, the number of observations, signal timing, trading opportunities, and cost sensitivity can all change.
Conclusion
Choose crypto trading bot timeframes as operating contracts, not popularity settings. Match the interval to the market question, define the completed-candle boundary, attach lookbacks to elapsed time, model the frequency burden, and monitor expected evaluations. Then lock the revision before judging the historical result.
Next step: open Gimmer’s Create a Strategy guide, write the market question and expected candle-close cadence, and lock one interval before the next backtest.
The Gimmer Team
Pingback: Crypto Backtest Volatility: Check the Return Series – Gimmer – Automated Crypto-Trading
Pingback: Crypto Backtest Exposure: Measure Time in the Market – Gimmer – Automated Crypto-Trading