
A distributed trace is valuable because it is specific. It can show which service handled a request, how long the trace ran, how many spans were captured, whether a span reported an error, and which attributes or events came with that path. That specificity is useful, but it also creates a trap: one trace can explain a slice of behavior without proving the whole incident.
This article is about reading trace details conservatively inside Gimmer’s observability workflow. It is not a production incident certification, a performance benchmark, or trading advice. It is the smaller habit of using one trace as scoped evidence before you decide which logs, metrics, route checks, exchange context, or bot activity still need review.
Start With The Scope Of The Surface
Gimmer’s observability surface starts with the broader job: Track runtime health in real time. It brings live KPIs, grouped runtime issues, traces, and the Tracez inspector into the same operational context.
That does not mean every panel answers every question for every runtime. In the current product source, the advanced trace panels are development-gated. That matters for public interpretation: trace details are useful for operators and technical reviewers working in the signed-in development observability surface, not as a blanket promise that every production reader has the same incident console in front of them.
The right reading posture is narrow. A trace can help you inspect a path. It should not become the whole story by itself.
Use Filters To Choose The Trace You Mean To Inspect
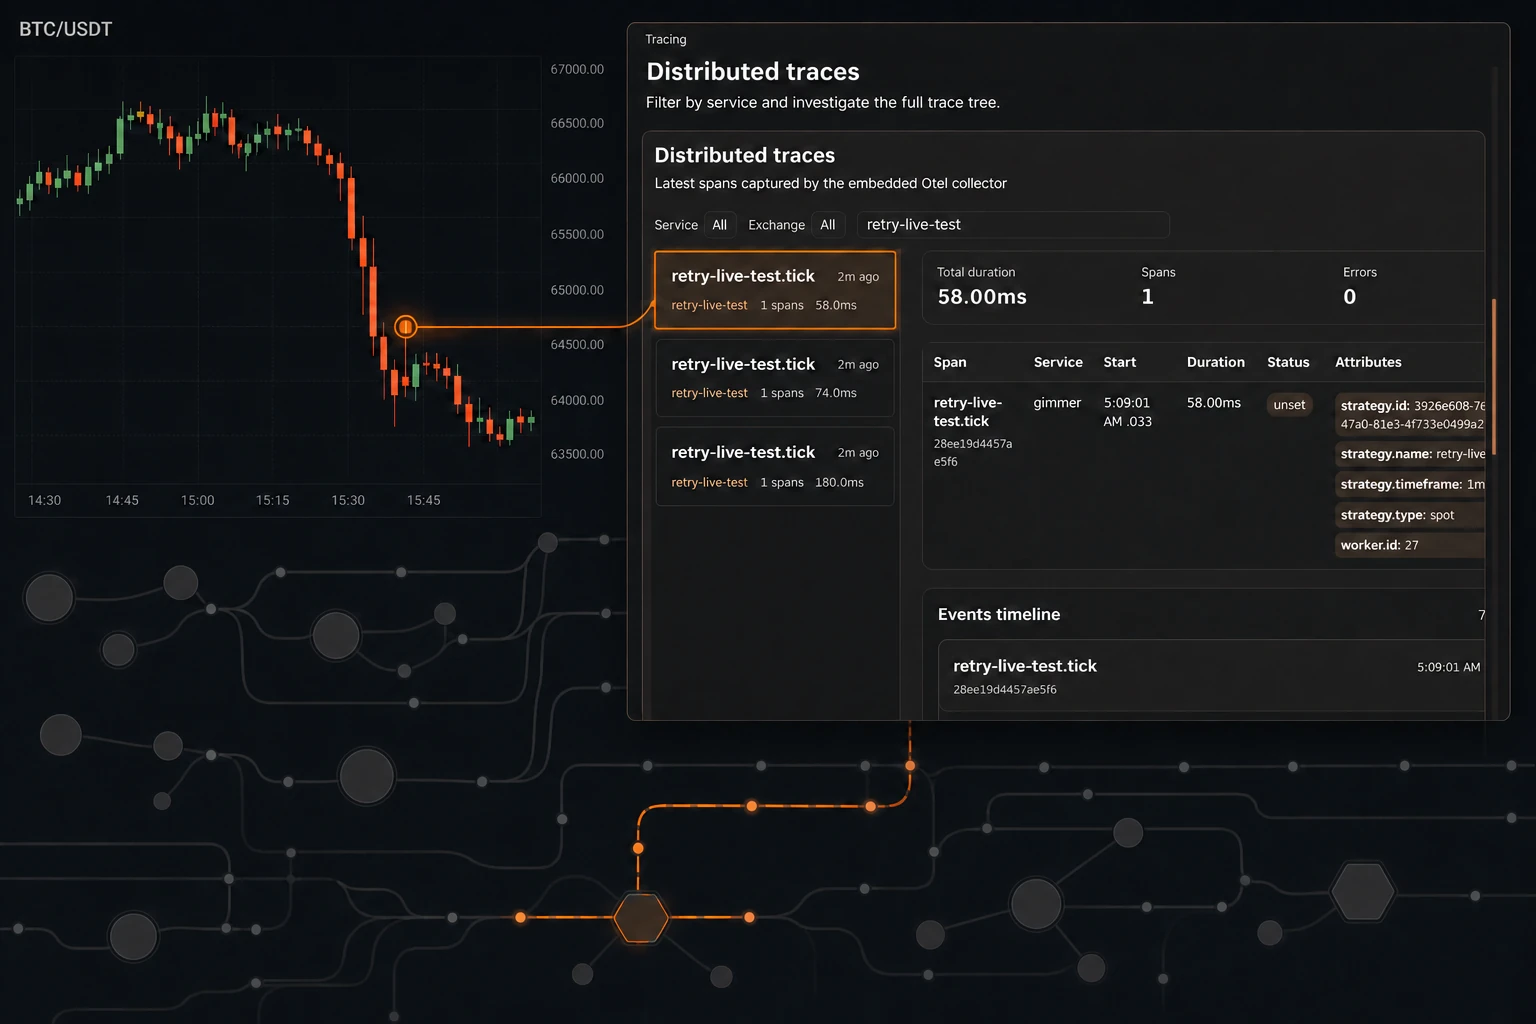
The Distributed traces panel gives you three practical ways to narrow the list before you open a detail view: Service, Exchange, and Filter by name.
Those controls are useful because a noisy trace list can lead to the wrong conclusion quickly. If your question is about a specific service, start with the service filter. If the question is exchange-adjacent, use the exchange filter to keep the market context separate. If you already know the route, operation, or span name you need, search by name before opening anything else.
Filtering is not proof of cause. It is a way to make sure the trace you inspect is actually related to the operational question you are asking about a crypto trading bot, exchange route, API request, or blockchain-adjacent workflow.
Read The Trace Card Before The Detail Table
Each trace summary gives you a small amount of context before you open the full detail. The list shows the root span name, recency, service or display context, span count, duration, and an error badge when the trace captured errors.
That summary helps you decide whether a trace deserves the next click. A long duration can point you toward latency review. A higher span count can suggest a broader path. An error badge can make the trace worth opening first. None of those signals is a final diagnosis.
The habit is simple: use the trace card to choose what to inspect, then use the detail view to understand that one path more carefully.
Use Duration, Spans, And Errors As A First Frame
When a trace is selected, Gimmer’s trace detail summarizes Total duration, Spans, and Errors.
Those three numbers are a good first frame because they answer different questions. Duration tells you how long the captured path took. Span count tells you how much of the path was represented. Error count tells you whether any spans reported an error status.
They do not answer the incident by themselves. A short trace can still be related to a larger problem. A long trace can be expected for some workflows. A trace with zero errors can still sit near a user-visible failure that appears elsewhere. Treat the summary as orientation, not verdict.
Read Span Rows As Evidence, Not A Story You Already Know
The detail table is where the trace becomes concrete. It shows Span, Service, Start, Duration, Status, and Attributes.
That row-level evidence can help you locate the part of the path that deserves attention. A span name can point to the operation. The service column can keep ownership clear. The start time and duration can show order and timing. The status field can show whether the span reported an error. Attributes can preserve important context that the instrumentation attached to that span.
The important word is “attached.” Attributes are only as complete as the instrumentation for that path. They are useful diagnostic context, not a complete audit log and not a guarantee that every relevant business state was captured.
Use Events To Understand What The Span Captured
Gimmer’s trace detail can also show an Events timeline. When events exist, the timeline keeps event name, time, index, and attributes tied to the span that captured them. When no span events are available, the route says so explicitly.
Both states are useful if you read them carefully. Events can show more texture inside a span. An empty event state tells you that this trace did not capture span events for the selected path. It does not prove that nothing happened outside the trace.
That distinction is especially important in trading automation. A trace detail can help you ask a better next question, but it should not replace route evidence, strategy activity, exchange response context, or support logs when those are still needed.
What One Trace Can Tell You Right Now
Used properly, a trace detail can answer useful first questions:
- Which service and root span does this trace appear to describe?
- How recent is the captured path?
- How long did the trace run, and how many spans were captured?
- Did any captured span report an error status?
- Which span attributes or events give useful local context?
- Which next evidence source should be checked after this trace?
That is enough value without turning the trace into a full incident report.
What One Trace Does Not Prove
This is where restraint protects trust.
- One trace does not prove the full root cause of an incident.
- A clean trace does not prove the platform, exchange, wallet, or trading bot is healthy.
- An error span does not prove the final cause without logs, metrics, route behavior, and surrounding evidence.
- Trace duration is not a user-facing performance guarantee.
- Trace attributes are not a complete audit trail.
- A trace detail does not replace QA verification, Product context, Security review, or CTO incident analysis.
Those limits make the trace more trustworthy, not less. A tool is easier to use well when it is clear what job it should not do.
A Practical Trace-Reading Routine
When a trace deserves inspection, keep the routine small:
- Start with the broader observability context: KPIs, recent errors, and the route or workflow that raised the question.
- Use service, exchange, or name filters to find the relevant trace.
- Read the trace summary before opening the detail.
- Use total duration, span count, and error count as orientation.
- Read span rows for service, timing, status, and attributes.
- Check the events timeline when events are present.
- Write down what the trace actually supports, then decide which logs, metrics, route checks, or operational records still need review.
This routine is intentionally modest. It does not ask one trace to become the whole incident story. It asks the trace to narrow the next question.
Final Thoughts
Good observability work often starts with a disciplined refusal to overread the first signal.
Gimmer’s trace detail view can make a specific runtime path easier to inspect. That is useful for crypto trading automation, exchange-adjacent debugging, API behavior, and operator workflows, but only when the trace stays in context. Read the selected trace carefully, record what it actually shows, and then confirm the broader incident story with the evidence around it.
Use a trace detail as one scoped clue, then confirm the broader incident story with the surrounding metrics, errors, logs, route context, and operational evidence.
– The Gimmer Team