
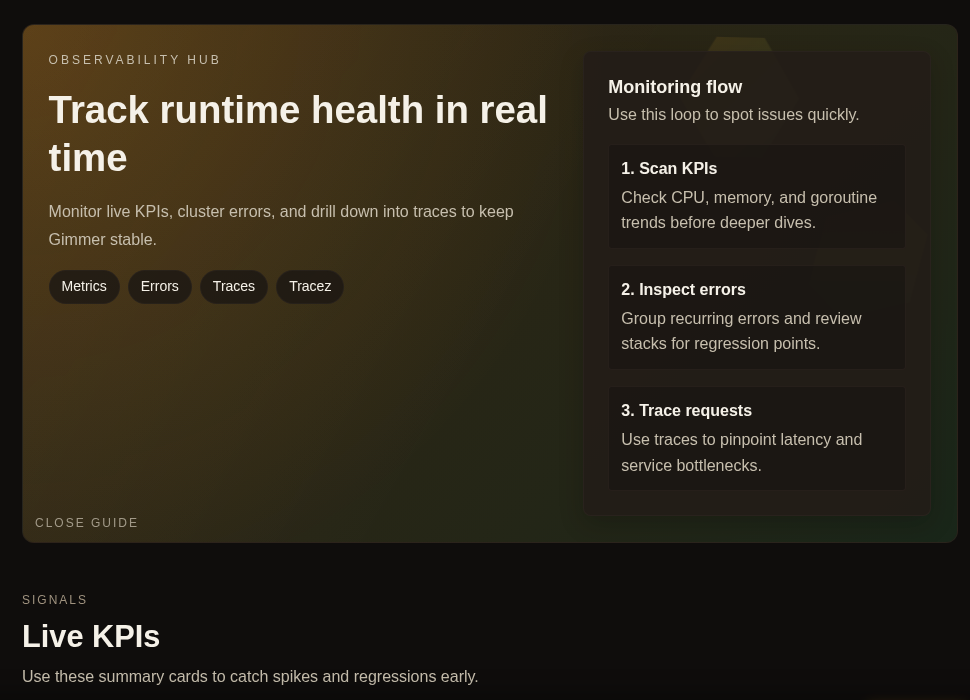
Open Observability Hub when you need a runtime-health first read, not a dramatic incident story. Start with Live KPIs, use the route’s Monitoring flow as the reading order, and only go deeper when the current runtime exposes more detail and the question actually needs it.
Why Attention Order Matters
Operators usually lose time before the real investigation starts. They react to a noisy symptom, open the deepest available surface, and start reading detail before they have decided whether the signal is broad, isolated, or even worth escalating.
Gimmer’s Observability Hub is more useful when you treat it as a first-check route. It gives you a visible reading order for runtime health before you spend attention on a deeper question.
That is the right job for the page today. It helps you prioritize operator attention. It does not pretend to settle every investigation from one screen.
Start With What The Route Shows First
The approved route framing already gives you the right posture. The page leads with Track runtime health in real time, shows a Monitoring flow, and keeps Live KPIs inside the same first read.
That matters because it keeps the page practical. You are not starting with a pile of raw detail. You are starting with a visible sequence that tells you how to read the route: scan the signal, decide whether it is broad enough to matter, and only then choose whether the next question needs more depth.
The safest way to use the page is to respect that order instead of skipping straight to a deeper diagnostic mindset.
Use Monitoring Flow As The Reading Order
The route’s own Monitoring flow gives you three steps: Scan KPIs, Inspect errors, and Trace requests.
That sequence is useful because it keeps investigation proportional. Start with the KPI layer so you can tell whether the system state looks calm, drifting, or clearly worth more attention. If the first read points to a real question, the route’s next cues tell you where deeper inspection belongs.
Treat those steps as a workflow, not as a promise that every runtime always exposes every deeper detail in exactly the same way. The page is helping you choose the next question, not manufacturing certainty.
Let Live KPIs Earn The Deeper Dive
Live KPIs are the part of the route that should win your attention first because they help answer the smallest useful question: Does the runtime state look quiet enough to stay at summary level, or is there a pattern here that deserves deeper inspection?
That is a healthier first move than opening a detailed error or trace view before you know whether the change is broad, rising, or already settling.
If the KPI read looks ordinary, you may not need to spend more time here. If it looks uneven, the route has already given you the next lens to use.
Go Deeper Only When The Current Runtime Exposes It
This is where the trust boundary matters. The article should not imply that every reader will always see the same deeper observability detail in every context.
Use the summary layer first. If the current runtime exposes deeper error or trace detail and the KPI read justifies more time, then continue. If that deeper detail is not exposed in the current context, keep the route in its proper role: a first-check surface that helps narrow the next question.
That keeps the workflow honest. Observability is helping you prioritize attention, not pretending to remove the need for route-specific verification.
A Calm Routine To Keep
A useful Observability Hub routine can stay small:
- Open Observability Hub when you need a runtime-health first read.
- Read Live KPIs before you assume you need a deeper investigation.
- Use Monitoring flow as the order for the next question: Scan KPIs, then Inspect errors, then Trace requests.
- Only go deeper when the current runtime exposes more detail and the summary read has already earned that extra attention.
- Keep final verification in the affected workflow instead of expecting this page to answer everything alone.
That routine is modest on purpose. It helps the operator spend attention where it matters instead of reacting to the first unsettling detail on screen.
Final Thoughts
The value of Gimmer’s Observability Hub today is not that it turns every operator into a telemetry specialist. It gives the operator a better order of operations.
Start with Live KPIs. Let the route’s visible Monitoring flow shape the next question. Go deeper only when the current runtime exposes more detail and the signal justifies it. That is how the page stays practical and trustworthy under pressure.
On your next runtime check inside Gimmer, open Observability Hub, read Live KPIs first, and let the route’s own Monitoring flow decide whether the next question needs deeper investigation.
— The Gimmer Team